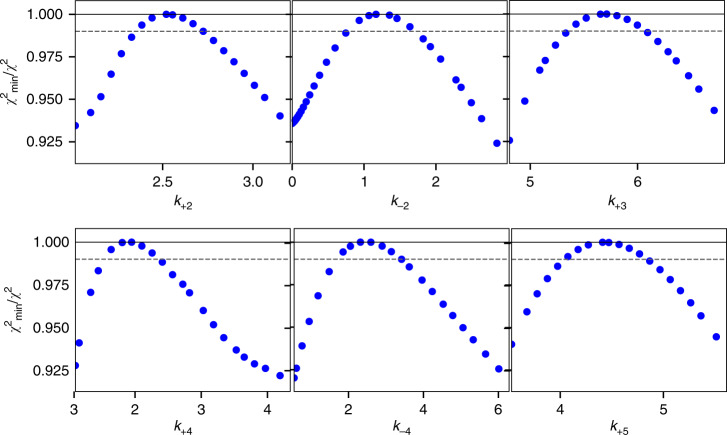
Fig. 6. Confidence contour analysis for global data fitting.
Confidence contours are shown for fitting data in Fig. 5. Numbered rate constants are defined in our kinetic model (Fig. 5f, inset). The χ2 threshold (dashed line) was set to 0.99 to define upper and lower limits for each rate constant as described17,32. Because the contours were symmetrical with parameters well constrained, we report ± error limits in Table 1. For this analysis a χ2 threshold was calculated using an F-distribution and was used to define the lower and upper limits for each parameter.

