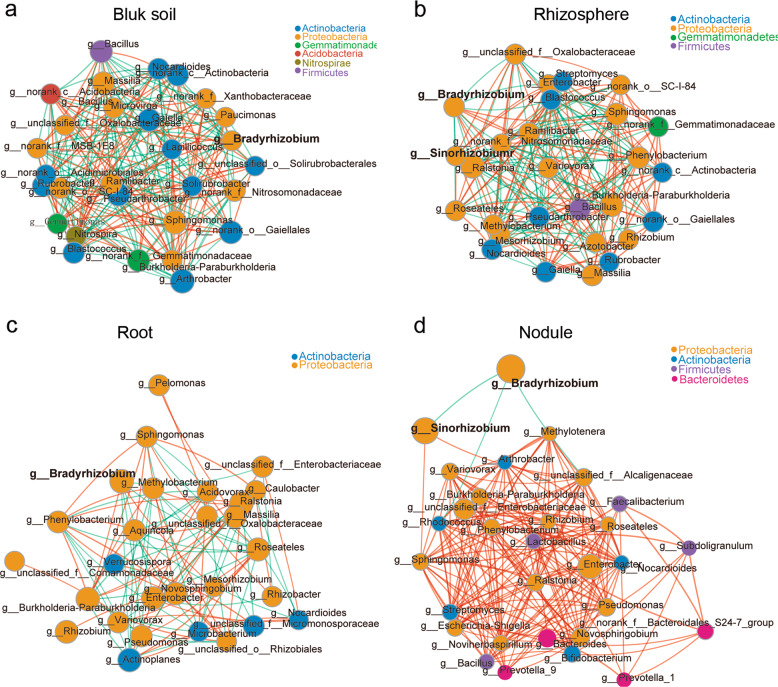
Fig. 2. Microbial interaction networks in the different compartments.
The interaction network of dominant microbiota at the genus level (top 30) in the bulk soil (a), rhizosphere (b), roots (c), and nodules (d). The size of the nodes shows the abundance of OTUs, and the different colors indicate the corresponding taxonomic assignment at the phylum level. The edge color represents positive (red) and negative (green) correlations. The edge thickness indicates the correlation values; only significant interactions are shown (r > 0.6; P < 0.05).

