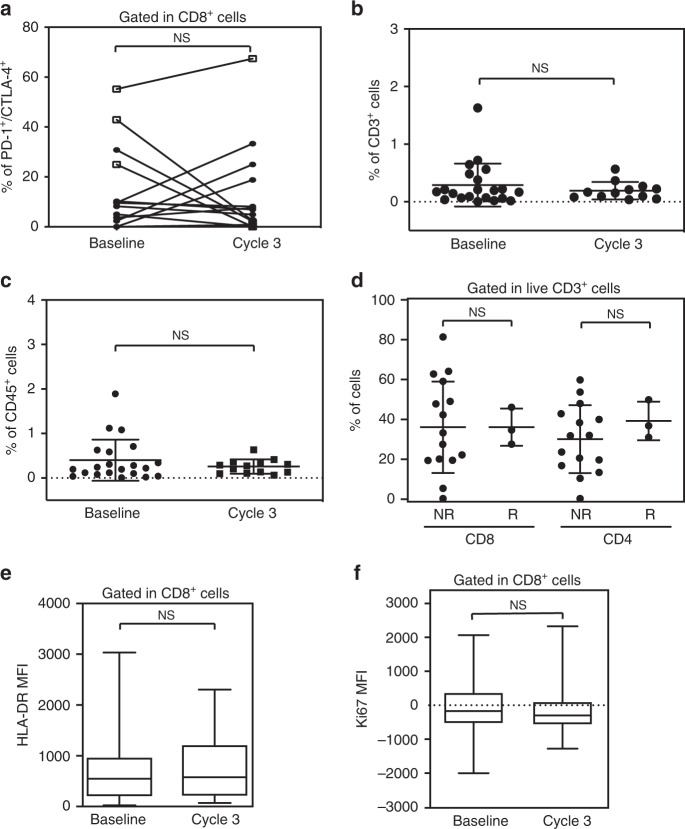
Fig. 3. No significant change in immune subsets was observed with treatment.
a Line plot for flow cytometry quantification of PD-1+CTLA-4+ live CD8+ T-cells in tumors pre and post therapy on cycle 3. Responders are indicated with an empty square, while non-responders with a full circle (n = 15). Flow cytometry quantification of CD3+ (b) and CD45+ cells (c) at baseline and post treatment. d Flow cytometry quantification of CD4+ and CD8+ in the tumor microenvironment in non-responders (NR) versus responders (R). Flow cytometric quantification of HLA-DR (e) and Ki67 (f) expression in live CD8+ T-cells from metastatic tumors before (Baseline) and after 3 cycles of treatment (Cycle 3) (n = 14). The markers represent the minimum, first quartile, median, third quartile, and maximum values, respectively (e, f). Data are presented as the mean ± SD. Statistical significance is indicated by p-values as *p ≤ 0.05; **p ≤ 0.01; ****p ≤ 0.0001; NS = not significant. This was assessed by two-tailed Wilcoxon text for a–c and e, f and by unpaired T test for D.

