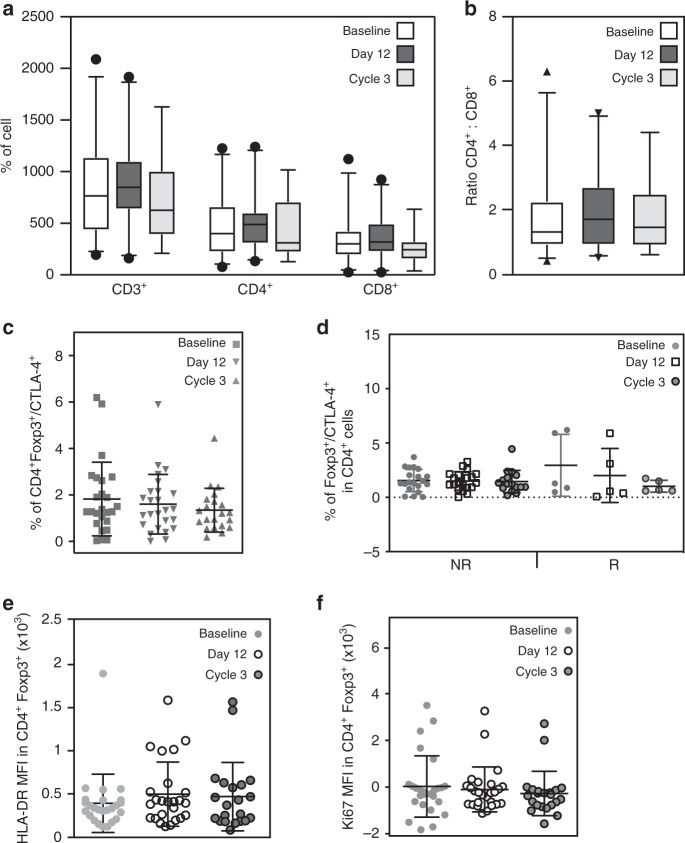
Fig. 5. Immune cell subsets evaluation in blood was not affected by the treatment.
Quantification of CD3, CD4 and CD8 cells (a) and ratio of CD4:CD8 cells (b) before beginning of treatment (Baseline), on day 12 of Cycle 1 (Day 12) and at the end of Cycle 3 (Cycle 3) (n = 25). The markers represent the 5th percentile, first quartile, median, third quartile, and 95th percentile values, respectively (a, b). c Flow cytometry quantification of Foxp3+CTLA-4+CD4+ Tregs at baseline, on day 12 Cycle 1 (Day 12) and at the end of Cycle 3 for all patients (n = 25). d Flow cytometry quantification of Foxp3+CTLA-4+ CD4+ Tregs in blood obtained from all the patients with or without a response (R and NR respectively) before treatment (Baseline), on Cycle 1 day 12 and at the end of Cycle 3 (n = 25). Flow cytometric quantification of HLA-DR (e) and Ki67 (f) expression in Foxp3+ CD4+ T-cells at baseline, on day 12 of Cycle 1 and at the end of Cycle 3 (n = 25). Data are presented as the mean ± SD. No statistical significance was found in any of the panels, This was determined by one-way ANOVA for a (CD3) and c and Kruskal-Wallis test for a (CD4 and CD8), b, d–f.

