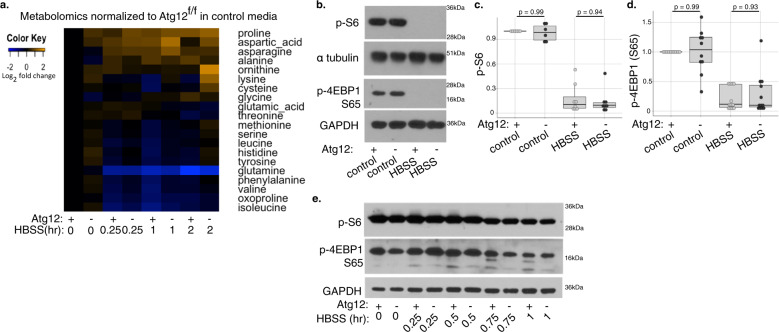
Fig. 2. Amino acid levels and mTORC1 activation not impaired by loss of ATG12.
a Changes in intracellular metabolite levels detected by GC-TOF with MTBSTFA (n = 4 biologically independent replicates), in Atg12f/f and Atg12KO MEFs in control media or following HBSS starvation for the indicated times. Fold change is relative to Atg12f/f in control media. b–dAtg12f/f and Atg12KO MEFs in control media or following 2 h HBSS starvation were lysed and immunoblotted for markers of mTORC1 signaling (p-S6, p-4EBP1). b Representative immunoblot is shown. Relative protein levels of (c) p-S6 and (d) p-4EBP1 were quantified, normalized to loading control, and shown as a boxplot with dotplot overlay for each biological replicate. Statistical analysis by ANOVA with Tukey’s HSD post hoc test was performed and p values for Atg12f/f samples compared with Atg12KO samples in control media or HBSS are shown. e Representative immunoblot for markers of mTORC1 signaling (p-S6, p-4EBP1) in Atg12f/f and Atg12KO MEF protein lysate following a timecourse of HBSS starvation.

