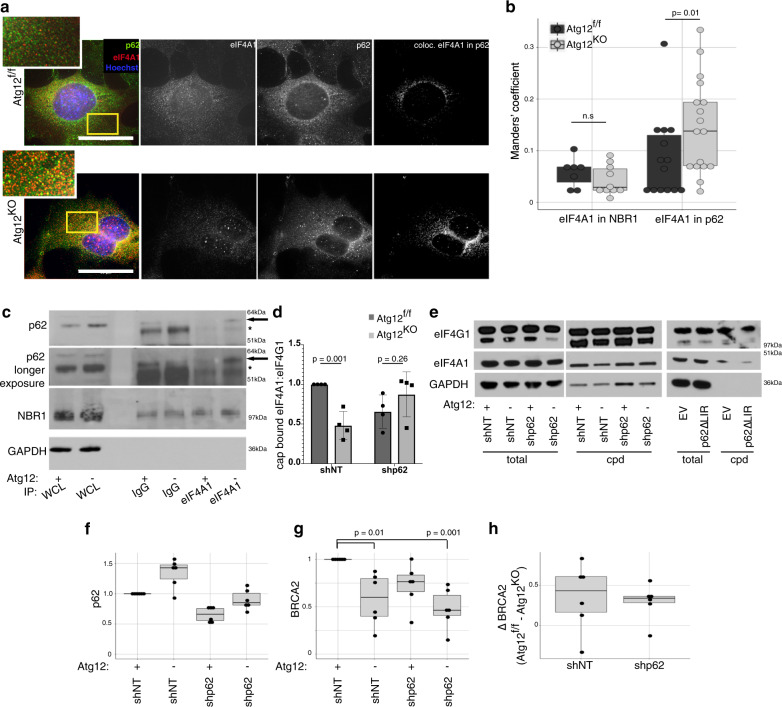
Fig. 6. eIF4A1 is sequestered by accumulated p62 in autophagy-deficient cells.
a Representative immunofluorescence images for eIF4A1 (red in merged imaged) and p62/SQSTM1 (green in merged imaged) in Atg12f/f and Atg12KO MEFs, nuclei were counterstained with Hoechst (blue). Yellow box indicates region of inset panel in the top left corner. Far right panels show the points of colocalization (white) of eIF4A1 in p62/SQSTM1. Bars = 50 μm. b Manders’ coefficient (percent of colocalization) of eIF4A1 in either NBR1 or p62/SQSTM1 in Atg12f/f and Atg12KO MEFs was calculated, and boxplot with dotplot overlay representing one field is shown (n = 3 biologically independent replicates). An outlier (Dixon test p = 0.03) was excluded from statistical analysis and the p values between Atg12f/f and Atg12KO were calculated by t test. c Representative immunoprecipitation of eIF4A1 and immunoblot for the autophagy cargo receptors p62/SQSTM1 and NBR1. Arrow indicates p62/SQSTM1, asterisk indicates immunoglobulin heavy chain. Immunoprecipitation was performed with three biologically independent replicates. d Protein lysate from Atg12f/f and Atg12KO MEFs that were knocked down for p62/SQSTM1 or treated with nontargeting shRNA was captured by cap pulldown, and the ratio of eIF4A1 to eIF4G1 was quantified (mean ± SD, n = 4 biologically independent replicates). e Protein lysate from Atg12f/f and Atg12KO MEFs that were knocked down for p62/SQSTM1 or treated with nontargeting shRNA or HEK293Ts that overexpress p62ΔLIR or empty vector control was captured by cap pulldown, and immunoblotted as indicated. f–h Protein lysate from Atg12f/f or Atg12KO MEFs stably infected with shRNA to p62/SQSTM1 or nontargeting control was collected. Relative quantification from immunoblots for f p62/SQSTM and g BRCA2, normalized to loading control are shown in the boxplot with dotplot overlay per biological replicate. p values were calculated using ANOVA with Tukey’s post hoc test and significant values are reported. h The change in BRCA2 levels between Atg12f/f and Atg12KO in shNT-treated cells or shp62-treated cells is plotted, p = 0.76 between shNT and shp62 for ΔBRCA2, calculated by t test.

