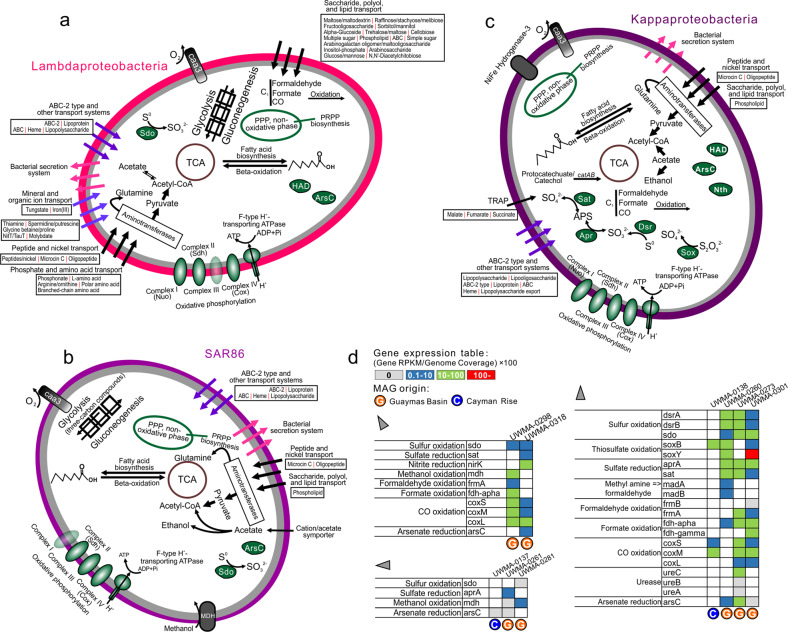
Fig. 4. Cellular maps of inferred metabolic capacities and activities of Lambdaproteobacteria, SAR86, and Kappaproteobacteria.
a–c Organismal profiles of metabolic capacity for Lambdaproteobacteria, Kappaproteobacteria, and SAR86, respectively. Items in gray indicate traits that are not present in over 50% of sampled genomes. d Tables indicating the normalized gene expression level of important pathways associated with energy metabolism in novel Proteobacteria genomes.

