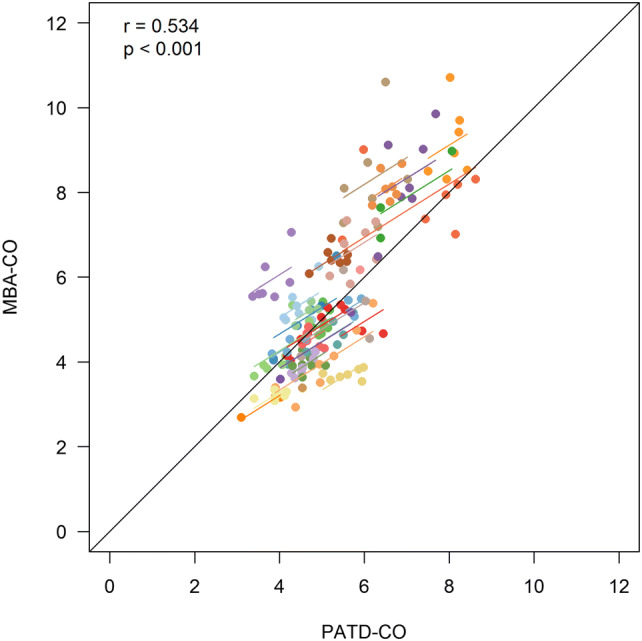
Fig. 1.

Scatter plot illustrating the relation of cardiac output estimations obtained with multi-beat analysis (MBA-CO; test method) and cardiac output measurements with pulmonary artery thermodilution (PATD-CO; reference method). The within-subject correlation coefficient (r) is presented along a respective illustration of the intra-individual linear trend. Patients are distinguished by color
