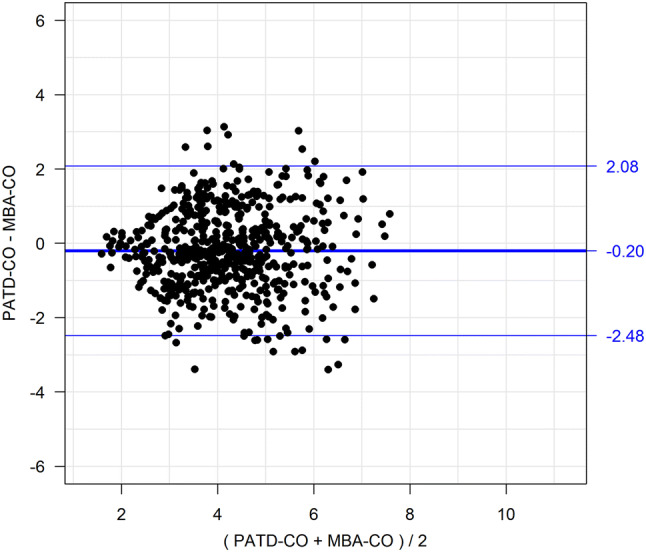
Fig. 2.

Bland–Altman plot showing the agreement between cardiac output estimations obtained with multi-beat analysis (MBA-CO; test method) and cardiac output measurements with pulmonary artery thermodilution (PATD-CO; reference method). The mean of the differences between MBA-CO and PATD-CO (bold horizontal line) and the upper and lower 95% limits of agreement (thin horizontal lines) are shown
