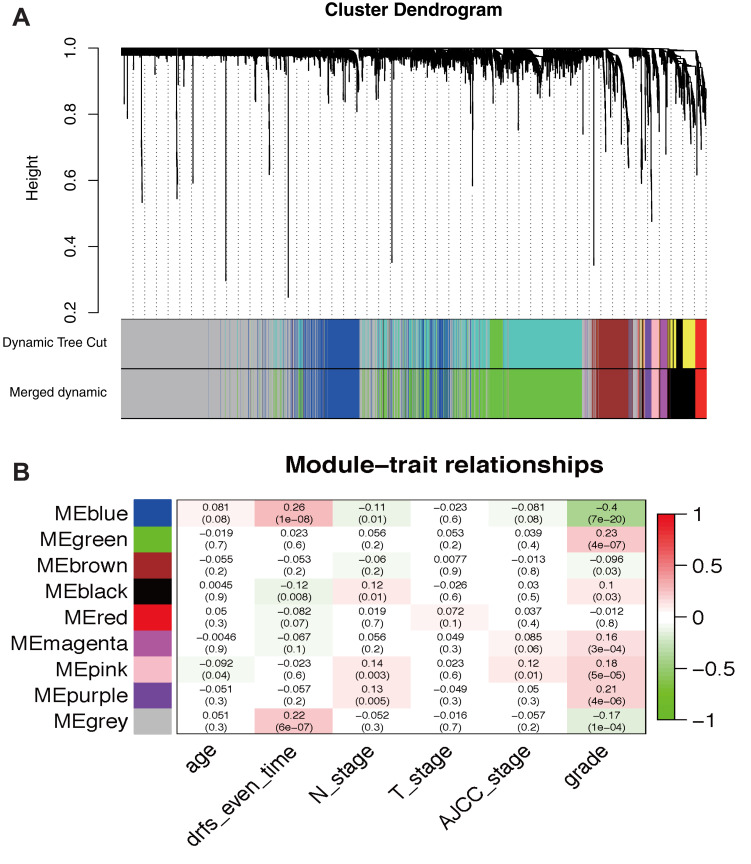
Figure 4.
Identification of modules associated with the clinical traits of breast cancer. (A) Dendrogram of all differentially expressed genes clustered based on the measurement of dissimilarity (1-TOM). The color band shows the results obtained from the automatic single-block analysis. (B) Heatmap of the correlation between the module eigengenes and clinical traits of BRCA. We selected the MEblue-grade block for subsequent analysis.
Abbreviations: TOM, topological overlap matrix; ME, module eigengene.

