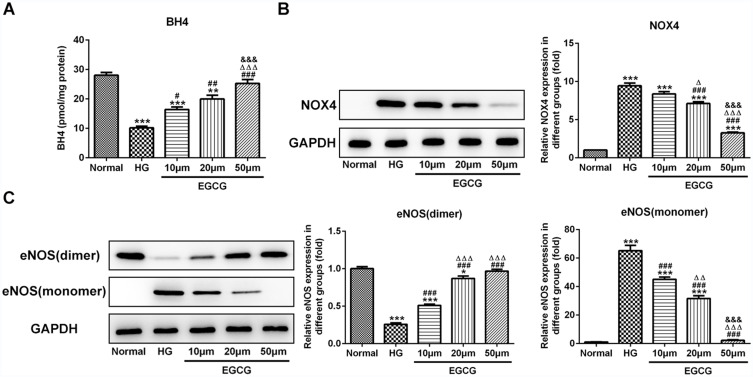
Figure 3.
EGCG increases the BH4 expression and inhibits the NOX4 expression and eNOS uncoupling. (A) The BH4 levels in HG-treated HUVECs affected by EGCG was determined by BH4 ELISA assay. **P<0.01 and ***P<0.001 vs Normal group. #P<0.05, ##P<0.01 and ###P<0.001 vs HG group. ∆∆∆P<0.001 vs EGCG10μM group. &&&P<0.001 vs EGCG20μM group. (B) The NOX4 expression in HG-treated HUVECs affected by EGCG was detected by Western blot analysis. ***P<0.001 vs Normal group. ###P<0.001 vs HG group. ∆P<0.05 and ∆∆∆P<0.001 vs EGCG10μM group. &&&P<0.001 vs EGCG20μM group. (C) The expression of eNOS (dimer) and eNOS (monomer) in HG-treated HUVECs affected by EGCG was detected by Western blot analysis. *P<0.05 and ***P<0.001 vs Normal group. ###P<0.001 vs HG group. ∆∆P<0.01 and ∆∆∆P<0.001 vs EGCG10μM group. &&&P<0.001 vs EGCG20μM group.

