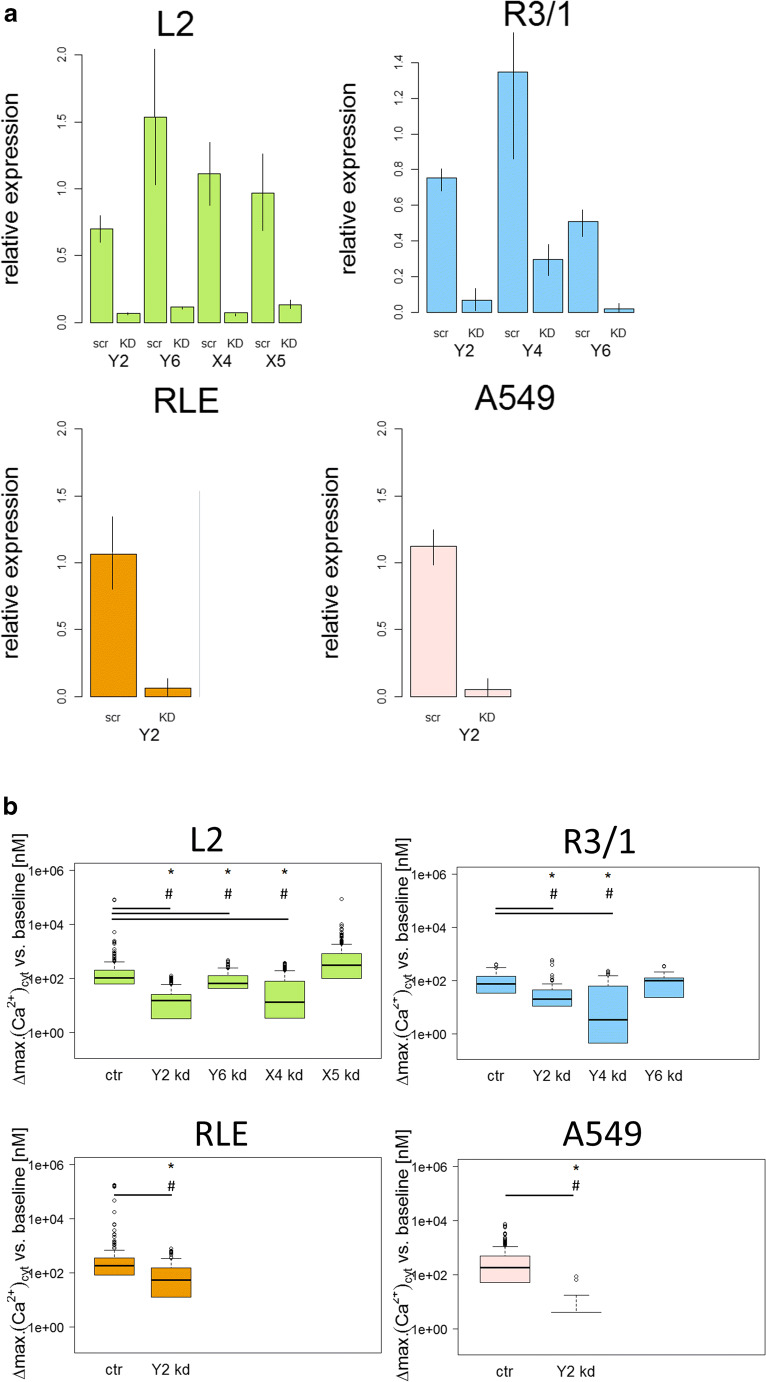
Fig. 7.
siRNA knockdown experiments of selective P2 receptors in L2, R3/1, RLE, and A549 cells. a Relative expression of the P2 receptor genes after siRNA knockdown using real-time quantitative RT-PCR (scr: scramble siRNA; KD: respective siRNA as indicated), n = 3–4 for each receptor and each AEC line investigated, mean ± SD. b [Ca2+]cyt following stimulation with ATP (100 μM) after siRNA knockdown as indicated. Displayed are differences between maximum and baseline [Ca2+]cyt. (∆: delta) as box plots, with median values ± 75% and 25% quartiles, n = 10–31, * p < 0.001 vs. baseline conditions, # p < 0.001 vs ctr

