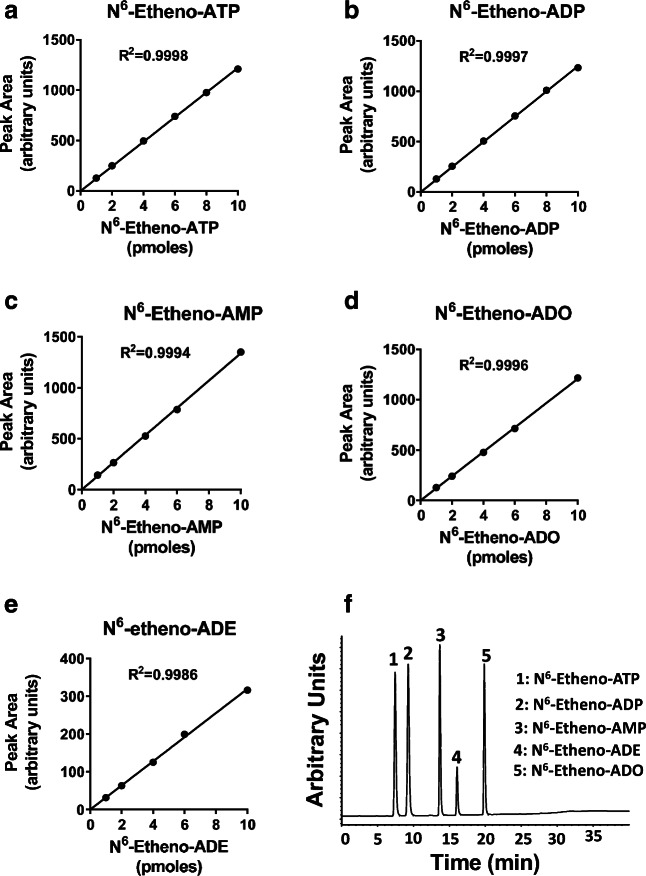
Fig. 2.
Line graphs show typical standard curves for a N6-etheno-ATP, b N6-etheno-ADP, c N6-etheno-AMP, d N6-etheno-adenosine (ADO), and e N6-etheno-adenine (ADE) using reverse phase high-performance liquid chromatography as described in detail in the “Analytical methods” section. Chromatogram (f) shows the baseline separation of N6-etheno-ATP, N6-etheno-ADP, N6-etheno-AMP, N6-etheno-adenine, and N6-etheno-adenosine using reverse phase high-performance liquid chromatography as described in detail in the “Analytical methods” section

