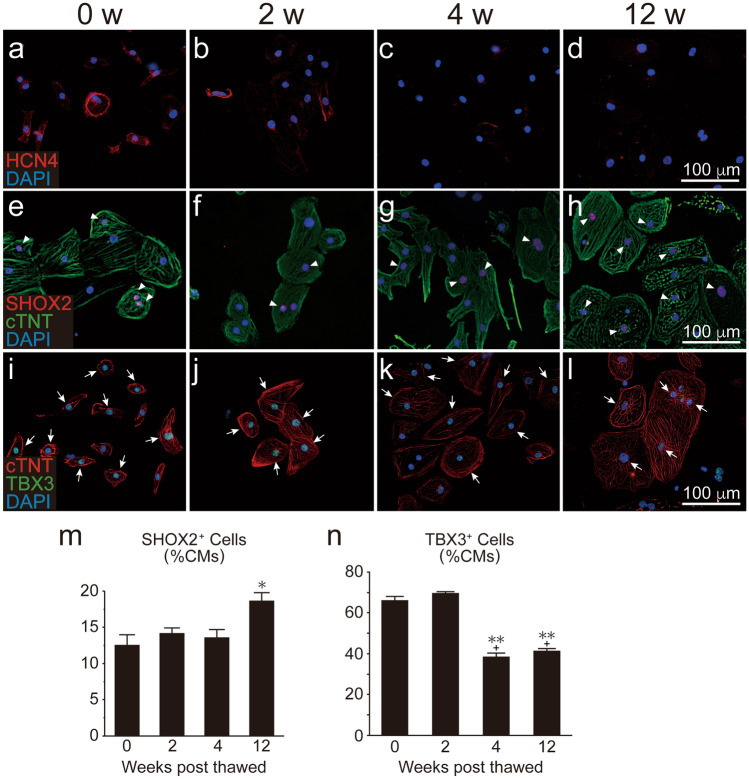
Figure 5.
Chronological expression of nodal markers in human ES cell-derived cardiomyocytes (hESC-CMs) on two-dimensional culture. Expression of nodal markers in hESC-CMs. Note that time scales in weeks correspond to those of the in vivo study depicted in Fig. 3. (a–d) HCN4 (red). (e–h) SHOX2 (red, arrowheads) and cTNT (green). (i–l) cTNT (red) and TBX3 (green, arrows). (m,n) Fractions of SHOX2+ and TBX3+ cardiomyocytes, respectively (n = 3 per group). Data are mean ± SEM. *P = 0.026 vs. 0 week by ANOVA with Tukey’s post hoc test in (m). **P < 0.0001 vs. 0 week, + P < 0.0001 vs. 2 weeks by ANOVA with Tukey’s post hoc test in (n).

