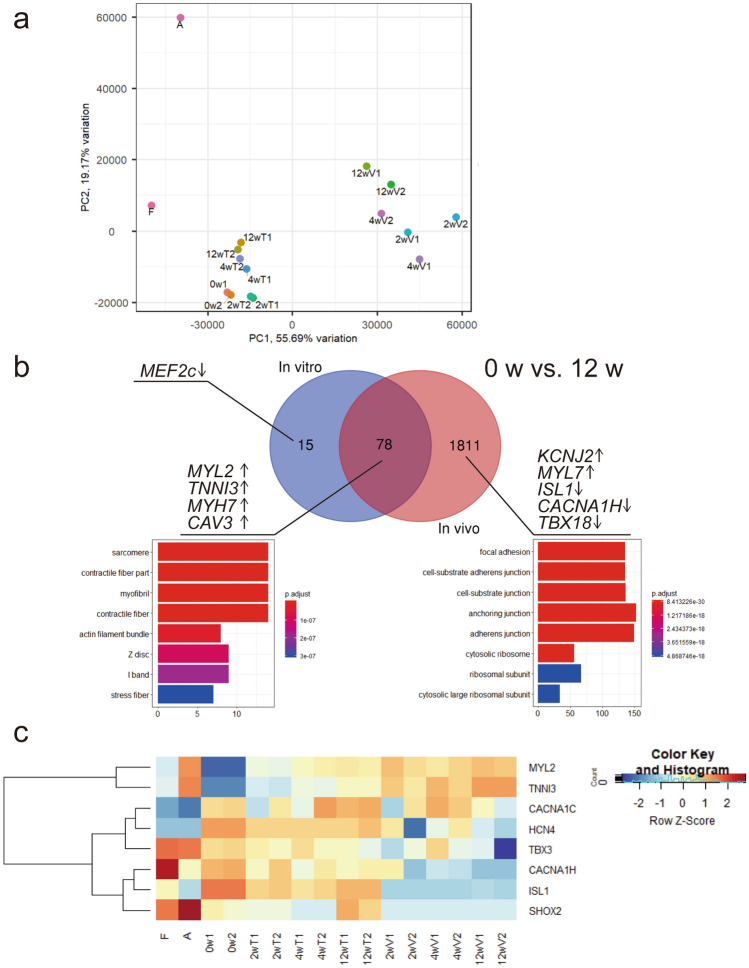
Figure 8.
RNA-sequencing analyses of in vitro and in vivo samples. (a) Principal-component analysis (PCA) plots with the computation of the closest neighbouring subpopulations. F fetal heart, A adult heart, 0 w harvested human ES cell-derived cardiomyocytes (hESC-CMs) at differentiation day 20. 2, 4, 12 wT in vitro samples cultured for 2, 4, and 12 weeks, respectively, 2, 4, and 12 wV in vivo samples of 2, 4, and 12 weeks following transplantation, respectively. (b) Comparative expression analysis of in vitro and in vivo enriched genes after 12 weeks over that of pre-treatment (0 week). Venn diagram showing overlap of in vitro and in vivo samples using a false-discovery rate cutoff of 0.01. The top eight enriched gene ontology terms are shown for each group. See also SI Table S2. (c) Heatmap showing time course expression of cardiac maturation and pacemaker-related genes. See also SI Figure S7.

