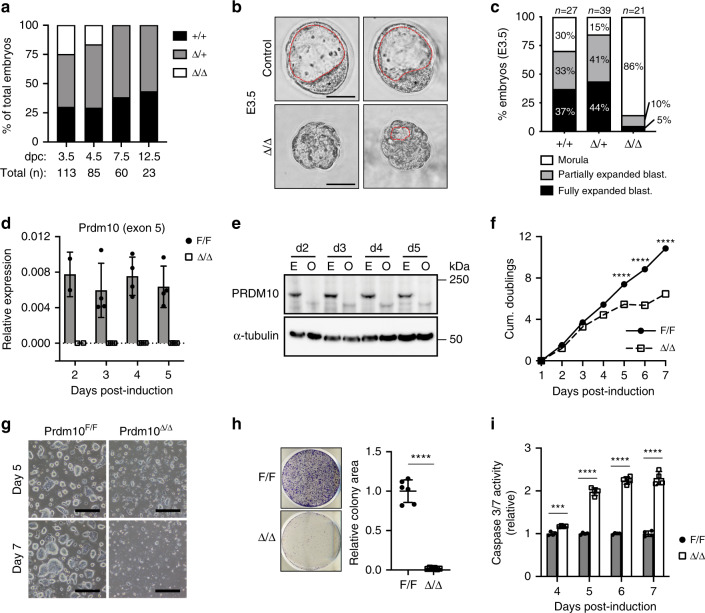
Fig. 1. Prdm10 is essential for mouse preimplantation embryogenesis and mESC growth.
a Frequency of embryo genotypes obtained from heterozygous intercrosses at each developmental stage. E3.5 embryos are recovered at the expected Mendelian distribution; no Prdm10Δ/Δ embryos are observed by E7.5. b Representative images of mutant (Prdm10Δ/Δ) and control (Prdm10+/+, Prdm10Δ/+) embryos isolated at E3.5. The inner cell mass (ICM) is labeled with an asterisk, and the blastocoel is defined by a red dashed line. Scale bar: 50 μm. c Scoring of E3.5 embryos into three phenotypic categories: morula, partially expanded blastocyst, or fully expanded/cavitated blastocyst. n = 27 (Prdm10+/+), n = 39 (Prdm10Δ/+), n = 21 (Prdm10Δ/Δ). d qRT-PCR analysis of Prdm10 exon 5 expression in OHT-treated Prdm10F/F; CreERT2 (Δ/Δ) mESCs compared with vehicle-treated (F/F) controls at indicated time-points post-induction. Expression normalized to Ubb; n = 3 biological replicates. e Western blot analysis of PRDM10 protein levels in Prdm10F/F; CreERT2 mESCs at indicated time-points (days) after exposure to EtOH (E) or OHT (O). Loading control, α-tubulin. f PRDM10-depleted mESCs exhibit an increasingly severe cell growth defect over time. Cells were passaged at constant density every 2 days and counted daily up to Day 7 post-induction; n = 4 samples. Y-axis: cumulative population doublings. g Representative brightfield images of Prdm10F/F and Prdm10Δ/Δ mESC colonies at Day 5 and 7 post-induction. Cells were plated at equal densities 2 days prior to image acquisition. Scale bar: 500 μm. h Representative images from colony formation assay; n = 6. Prdm10F/F and Prdm10Δ/Δ mESCs were seeded at Day 3 post-induction and fixed for analysis at Day 8. i Caspase 3/7 activity in Prdm10Δ/Δ mESCs relative to Prdm10F/F controls, at Day 4 to 7 post-induction; n = 4 technical replicates for each time-point. Data are presented as mean ± s.d. Representative data shown from one out of three independent experiments (f, g, and i). ***P < 0.001, ****P < 0.0001; two-tailed unpaired Student’s t test (f, h, and i).

