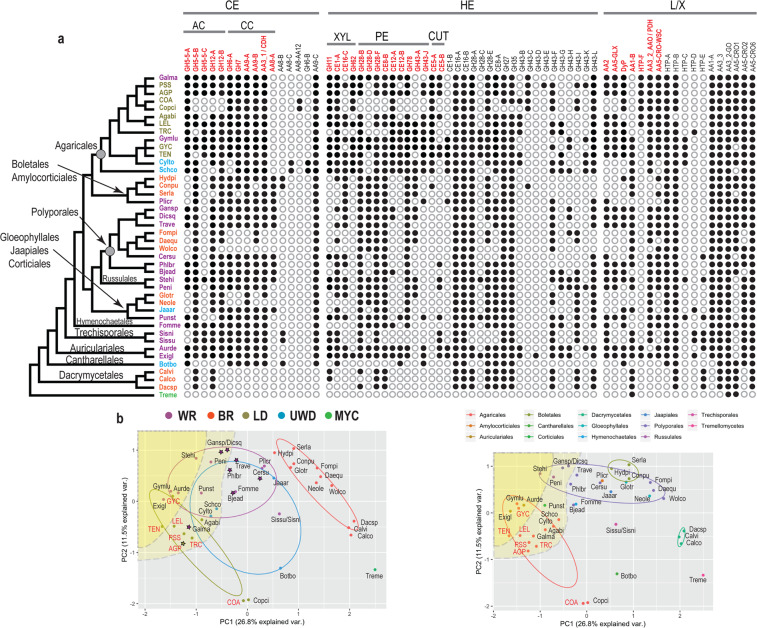
Fig. 2. Phylogroup abundance patterns in mushroom-forming fungi.
a. Presence (filled circles)/absence (unfilled circles) of 68 phylogroups across 42 species (species names can be found in Tables S1 and S3). The species tree is based on a phylogenomic tree published in Varga et al. [81]. Species acronyms colors are as in b. Phylogroup names in red indicate the phylogroups that have the strongest contribution according to the PCA analysis (≥0.15 or ≤0.15, Table S6). Phylogroups associated with the degradation of specific biopolymers are indicated by: CE (cellulose), AC (amorphous cellulose), CC (crystalline cellulose), HE (hemicellulose), XYL (xylan), CUT (cutin), and lignin/xenobiotics (L/X). b PCA plots from the P/A PCA analysis showing the grouping of the species based on nutritional strategy (left) and order classification (right). Species acronyms in red denote newly sequenced genomes. The yellow shaded areas include genomes that have genes in more than 75% (deep yellow) or more than 60% (light yellow) of the phylogroups. Species that code for high-redox potential Class II peroxidases (AA2) are shown with stars. Nutritional strategies: mycoparasite (MYC), brown-rot (BR), uncertain wood decay type (UWD), litter decomposer (LD), white-rot (WR). Species names can be found in Tables S1 and S3.

