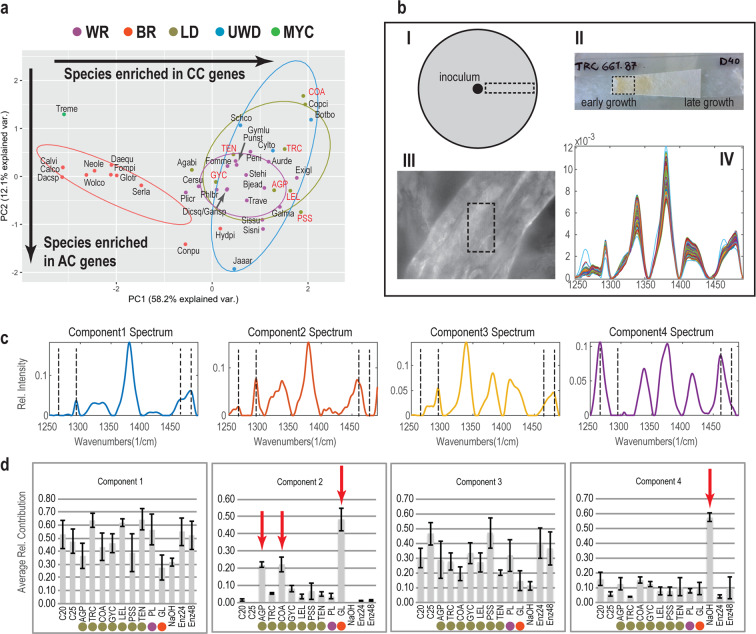
Fig. 3. Distribution of cellulose decomposition genes and cellulose-degradation patterns across litter decomposing, white-rot, and brown-rot fungi.
a PCA plot showing the distribution of cellulose genes from 16 phylogroups across 42 fungal species. CC: crystalline cellulose, AC: amorphous cellulose. The newly sequenced genomes are shown in red font. Species names can be found in Tables S1 and S3. Nutritional strategies: mycoparasite (MYC), brown-rot (BR), uncertain wood decay type (UWD), litter decomposer (LD), white-rot (WR). b Cellulose sample processing and Raman data collection. I-II. After incubation with fungi, NaOH or a commercial mix of cellulolytic enzymes (Cellic CTec2), a piece of the paper was radially excised and placed on a glass slide. III. A cellulose fiber under ×100 magnification. Raman data were collected from a rectangular area on the fiber. IV. Example of Raman data after area normalization, baseline correction, and smoothing using Savitzky–Golay (S–G) filtering. c. The four major Raman spectra components of cellulose resulting from MCR-ALS analyses. Black dashed lines indicate peaks related to crystalline and amorphous cellulose. d The average contribution of each component from panel c for each of the fungal samples, controls, enzymatic, or chemical treatments. Bars indicate standard error calculated from 198 or 126 spectra. Red arrows indicate species or treatments that transformed crystalline cellulose into amorphous. Colors indicate nutritional strategies as in a. C20, C25: control samples at 20 and 25 C, respectively; Enz24, Enz48: enzymatic treatment samples from the highest enzyme concentration at 24 h and 48 h, respectively.

