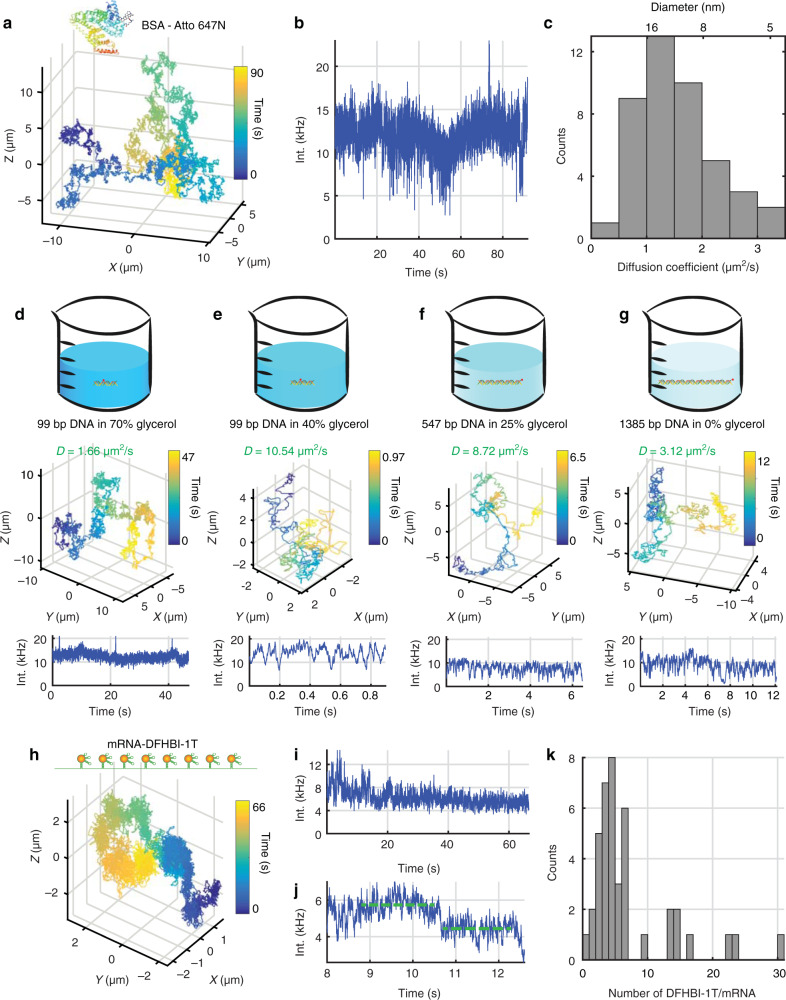
Fig. 3. Application of 3D-SMART to biomolecules.
a–c, 3D trajectory, intensity trace, and histogram of diffusion coefficients for single BSA molecules in 73.5 wt% glycerol (number of trajectories n = 43, bin siz = 0.5 μm2/s). d–g Tracking a range of dsDNA lengths at indicated glycerol concentrations. d 99 bp dsDNA tracking in 70 wt% glycerol-water solution. e 99 bp dsDNA tracking in 40 wt% glycerol. f 547 bps dsDNA tracking in 25 wt% glycerol. g 1385 bp dsDNA tracking in PBS solution. h, i 3D trajectory and intensity trace of DFHBI-1T labeled single Spinach RNA aptamers tracking in 75 wt% glycerol. j Stepwise bleaching is used to calculate the intensity of single DFHBI-1T dye. k The histogram of the number of DFHBI-1T for single Spinach RNA aptamers (number of trajectories n = 41, bin size = 1).

