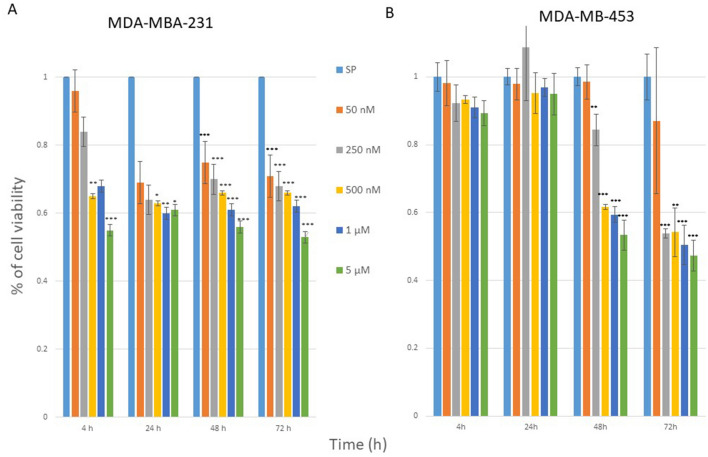
Figure 2.
Cell viability after compound 1 treatment. Notes Cells were treated with a different concentration of compound 1 for 4, 24, 48 and 72 h in the MDA-MB-231 (A) and in the MDA-MB-453 cell line (B) and cell metabolism evaluated by the 3-(4,5-dimethylthiazolyl-2)-2,5-diphenyltetrazolium bromide (MTT) assay. Data are expressed as a mean from experiment performed in triplicate ± SD. Columns, mean of viable cells; bars, SD (standard deviation); *P < 0.05; **P < 0.01; ***P < 0.001. SD standard deviation.

