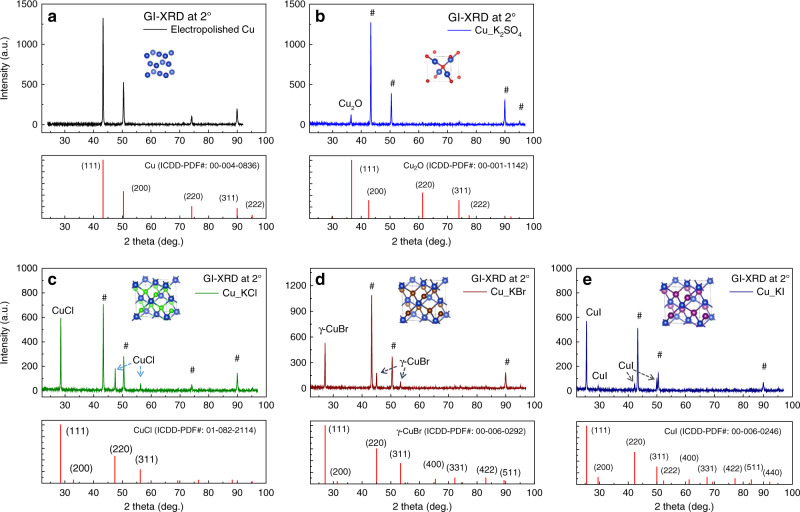
Fig. 2. Crystal structures of halogenated Cu identified by grazing incident X-ray diffraction.
GI-XRD patterns of the original electropolished Cu foil (a). Cu foils oxidized in 0.05 M K2SO4 at 1.1 V vs. Ag/AgCl for 300 s (control sample) (b), or halogenated in KCl (c), in KBr (d), and in KI (e) for 100, 60, and 30 s, respectively. The symbol # indicates peaks corresponding to the underlying Cu-foil substrate. The incidence angle used for GI-XRD was 2°. The inset of each GI-XRD plot is a diagram of the unit cell for Cu, Cu2O, CuCl, CuBr, and CuI, from (a) to (e), respectively. Cu atoms are represented as blue spheres. Source data are provided as a Source data file.

