
Fig. 5. Strength of nonlinearity vs pump.
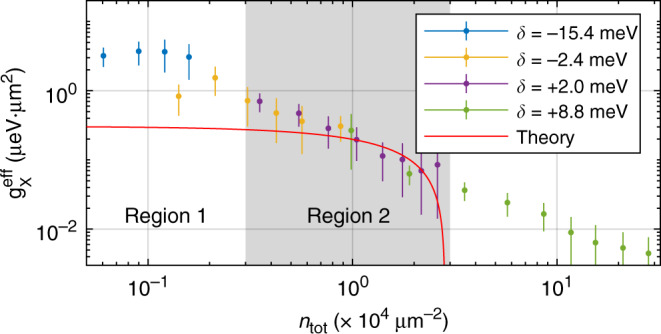
The experimental effective interaction constant is shown as a function of the estimated exciton density, ntot. The is deduced from the energy blueshift of MPB (see Supplementary Note 1.5). The data correspond to four different cavity–exciton detunings (δ): +8.8 meV (olive), +2.0 meV (purple), −2.4 meV (orange), and −15.4 meV (blue). The error bars (95% CI) are deduced taking into account errors in determining the MPB peak positions at each pump power (exciton density). The red solid curve corresponds to the theoretical values.