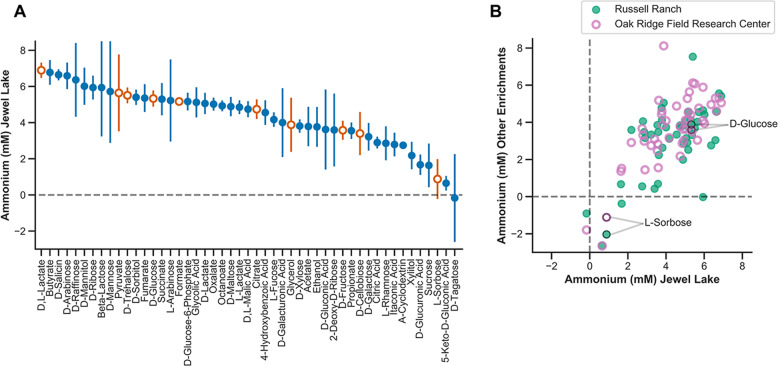
Fig. 2. Influence of selective carbon sources on ammonium production in enrichment cultures.
a Ammonium production (mM) of the Jewel Lake enrichment cultured on 48 diverse sugars, organic acids, and alcohols. Symbols represent means and error bars represent the standard deviation of four replicates. Orange, open symbols are carbon sources selected for further 16S microbial community analysis, isolations, and metagenomics. b Mean ammonium produced (mM) by cultures cultured on the 48 diverse carbon sources (shown in a) compared between the Jewel Lake enrichment and the Russell Ranch (closed symbols) or Oak Ridge Field Research Center enrichments (open symbols).

