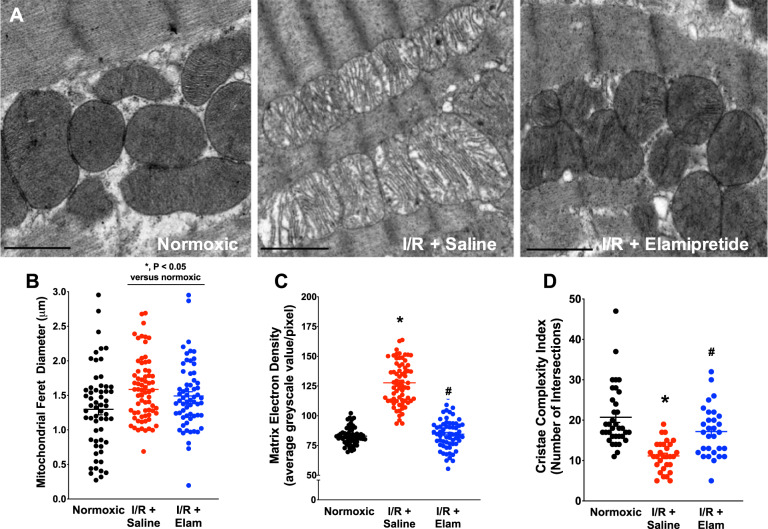
Fig. 2. TEM data from hearts in the study.
a Representative images from experimental groups. b Images were analyzed for mitochondrial Feret diameter (N = 59 for normoxic, N = 70 for I/R + saline, and N = 62 for I/R + Elam), c matrix electron density (N = 59 for normoxic, N = 70 for I/R + saline, and N = 62 for I/R + Elam), and d cristae complexity index (N = 35 for normoxic, N = 30 for I/R + saline and I/R + Elam). *P < 0.05 v normoxic; #P < 0.05 versus I/R + Saline. Scale bar represents 2 µm.

