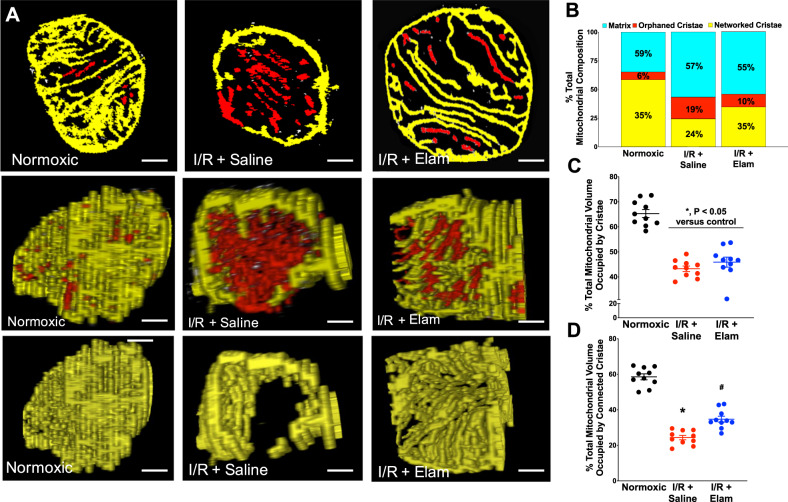
Fig. 4. Serial block-face scanning electron microscopy (SBF–SEM) images of single mitochondrial ultrastructure in the experimental groups.
Mitochondria were analyzed for cristae connectivity. a Top panel: individual slices from SBF–SEM imaging showing cristae networking. Middle panel: cross-section of composite stacks indicating networked (yellow) and orphaned cristae (red). Bottom panel: mitochondrial cross-section showing only networked cristae (from middle panel). Composition of total mitochondrial volume (b), total cristae volume (c), and connected cristae volume (d) were measured in each experimental groups. N = 10 for all groups. Scal bar represents 250 nm. *P < 0.05 versus normoxic; #P < 0.05 versus I/R.

