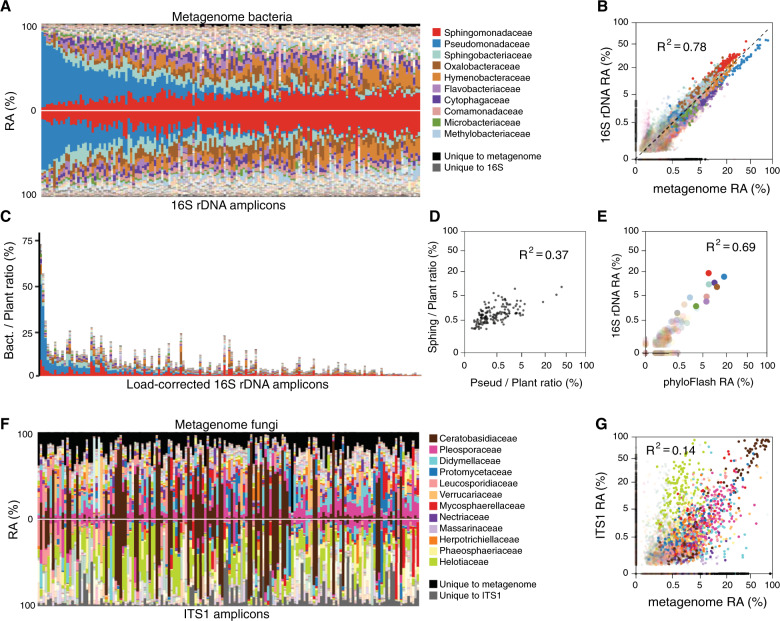
Fig. 4. Enhancing utility of metagenome data with parallel amplicon data.
a The relative abundances (RA) of bacterial families as determined by the shotgun metagenome pipeline (top) mirrored against bacterial families as determined by the 16S V4 rDNA amplicon pipeline (bottom) for batch 3 plants (columns). Samples in all panels are ordered by the abundance of Pseudomonadaceae (blue) in the metagenome. Taxa unique to the metagenome are shown in black, those unique to amplicons in dark gray. b The two datasets from a, fourth root-transformed and shown as a scatterplot. The dotted line represents 1:1 correlation. c The amplicon data from a, bottom, scaled by common taxa shared between the metagenome and amplicon data. d The data in c, fourth root transformed and shown as a scatterplot. e Scatterplot of fourth root-transformed bacterial family abundances, comparing 16S rDNA amplicon data with 16S rDNA sequences detectable in the metagenome (using phyloFlash). Same color scheme for families as in a–d. f The RA of fungal families as determined by the shotgun metagenome pipeline (top) mirrored against fungal families as determined by the ITS1 rDNA amplicon pipeline (bottom) for batch 3 plants (columns). Samples are ordered as in a. Taxa unique to the metagenome are shown in black, those unique to amplicons in dark gray. g Scatterplot of fourth root-transformed data from f.

