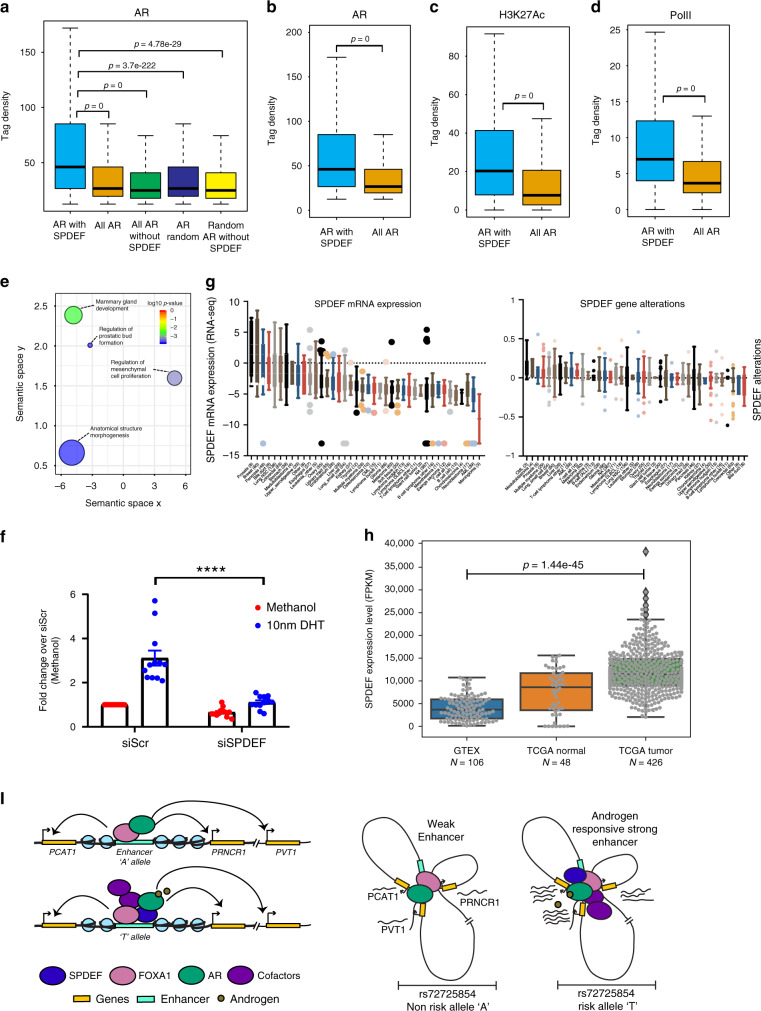
Fig. 6. SPDEF collaborates with AR to induce prostate-specific genes.
a Tag density plots show the relative levels of AR on various combinations of AR and SPDEF peaks mentioned on X axis. Tag density plots suggest a higher density of AR (b) H3K27ac (c), and PolII (d) occupancy on the AR-SPDEF co-occurring peaks as compared to all AR peaks. The boxplots in a–d depict the minima (Q1-1.5*IQR), first quartile, median, third quartile and maxima (Q3 + 1.5*IQR). p-values were calculated by Wilcoxon two-sided rank sum test in a–d. e GO term analysis on genes nearby SPDEF-AR co-occurring peaks indicates that these regions are involved in the development programs including prostate. Position of GO terms on the X and Y axis represents the relative closeness between GO terms based on GO graph structure. Size of circles represents the frequency of a particular GO term in the GO database. Color of the circle represents multiple test corrected p-value, see legend on the top right. f Reporter assays showing the change in DHT response of the “T” allele upon SPDEF knockdown. Error bars denote SEM from n > 3 biological replicates. p-value was calculated by Student’s two-tailed unpaired t-test (****p < 0.0001). g SPDEF RNA expression and alterations across different cell lines from CCLE data sets. h SPDEF RNA expression levels plotted across different data sets, prostate normal tissue from GTEx, prostate adenocarcinomas and adjacent normal tissues from TCGA. p-value was calculated using Wilcoxon two-sided rank sum test. i Model depicts that the rs72725854 region functions like an enhancer even in the non-risk allele. The enhancer exhibits closer proximity to the lncRNA genes PCAT1, PRNCR1, and PVT1. Enhancer with risk allele recruits SPDEF, which in turn brings AR-activating machinery in response to DHT, resulting in the hyper-activation of the enhancer. Full enhancer activation robustly induces expression of target lncRNAs and MYC promoters that are already in 3D proximity. lncRNA and MYC activation potentially predisposes these individuals to prostate cancer. Source data are provided as a Source Data file.

