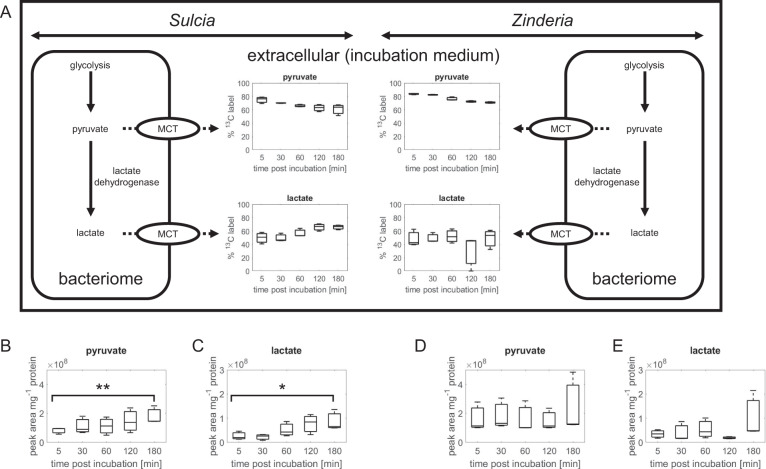
Fig. 4. Comparison of pyruvate and lactate release from Sulcia and Zinderia-spittlebug bacteriomes.
Extracellular pyruvate and lactate, expressed as percentage of 13C-label in Sulcia and Zinderia (a) and expressed as area count, for pyruvate and lactate in Sulcia (b, c) and Zinderia (d, e). Asterisks indicate significant differences between specific timepoints compared with the 5 min timepoint. *p < 0.1; **p < 0.05.

