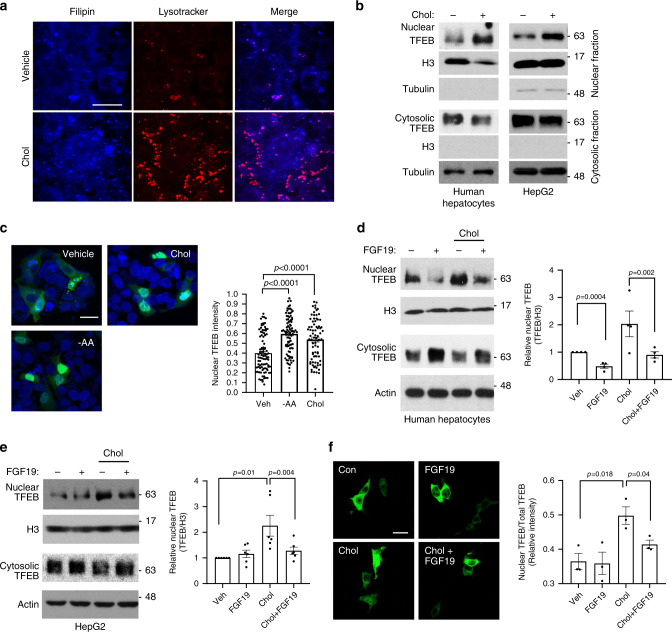
Fig. 3. FGF19 inhibits lysosomal stress-induced TFEB nuclear translocation.
a HepG2 cells were treated with vehicle (Veh) or 25 µg ml−1 cholesterol for 8 h and stained with lysotracker red and filipin. Images were acquired with a confocal microscope. Scale bar: 30 µm. Images are representative of three independent experiments with similar results. b Nuclear and cytosolic TFEB protein in human hepatocytes and HepG2 cells treated with 25 µg ml−1 cholesterol for 6 h. H3: histone 3. Representative images of at least four independent experiments. c HepG2 cells were transfected with TFEB-GFP expression plasmid. After 24 h, cells were treated with 25 µg ml−1 cholesterol for 8 h or cultured in amino acid free EBSS culture medium for 3 h. Nuclei were stained with DAPI. Left panel, Confocal microscope was used to acquire images. Scale bar: 20 µm. Right panel, average nuclear/total GFP fluorescent intensity of ~80–100 cells. Results were expressed as mean ± SD. d Nuclear and cytosolic TFEB protein. Human hepatocytes were treated with 50 ng ml−1 FGF19 for 30 min followed by 25 µg ml−1 cholesterol treatment for 6 h. Left panel: A representative blot. Right panel: Average nuclear TFEB protein normalized to histone 3 (H3) in four independent preparations of human hepatocytes (n = 4). Control value was arbitrarily set as 1. e Nuclear and cytosolic TFEB protein in HepG2 cells. Treatment was the same as in d. Left panel: A representative blot. Right panel: Average nuclear TFEB protein normalized to histone 3 (H3) of six independent experiments. Control value was arbitrarily set as 1. f TFEB-FLAG expression plasmids were transfected in HepG2 cells. After overnight culture in serum free medium, cells were treated as in d. Immunostaining was performed with anti-FLAG antibody. Left panel: representative confocal image (Scale bar: 25 µm). Right panel: Average nuclear/total fluorescent intensity of three independent experiments (Total of 250–360 cells were analyzed per condition). All results in d–f were expressed as mean ± SEM. Two-sided Student’s t-test was used for c–f. Source data for b–f are provided as a Source Data file.

