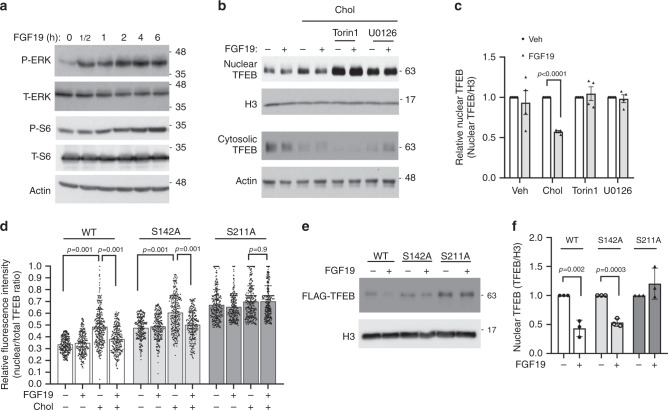
Fig. 4. FGF19 inhibition of TFEB nuclear translocation requires mTOR/ERK activation and TFEB phosphorylation.
a HepG2 cells were serum starved overnight and treated with 50 ng ml−1 FGF19 in time course. Phosphorylated and total ERK and S6 were measured to confirm ERK and mTOR signaling activation. Images are representative of three independent experiments with similar results. b Nuclear and cytosolic TFEB abundance in overnight serum starved HepG2 cells treated with 25 µg ml−1 cholesterol, 250 nM Torin 1, 10 µM U0126, and 50 ng ml−1 FGF19 as indicated for 6 h. H3: histone 3. Images are representative of 4 independent experiments. c Same treatment as in b. Average nuclear TFEB abundance of 4 independent experiments. d WT, S142, and S211 FLAG-tagged TFEB expression plasmids were transfected into HepG2 cells. After overnight culture, cells were treated with 25 µg ml−1 cholesterol and/or 50 ng ml−1 FGF19 as indicated for 6 h. FLAG-TFEB were detected by immunostaining against FLAG and nuclei were stained with DAPI. Nuclear TFEB/total TFEB of total of 282, 235, 315, 250, 247, 247, 288, 249, 282, 249, 308, and 301 cells per condition (from left to right) from three independent experiments were calculated based on FLAG fluorescent intensity obtained with ImageJ. e, f WT, S142A, and S211A FLAG-tagged TFEB expression plasmids were transfected into HepG2 cells. After overnight culture, all cells were treated with 25 µg ml−1 cholesterol with/without 50 ng ml−1 FGF19 as indicated for 6 h. Nuclear fraction was used to detect FLAG-TFEB and histone 3 (H3). Average nuclear FLAG-TFEB abundance of three independent experiments was shown in f. Results in d were expressed as mean ± SD. Results in c and f were expressed as mean ± SEM. Two-sided Student’s t-test was used for c and f. Two-way ANOVA and Tukey post hoc were used for d. Source data for a–f are provided as a Source Data file.

