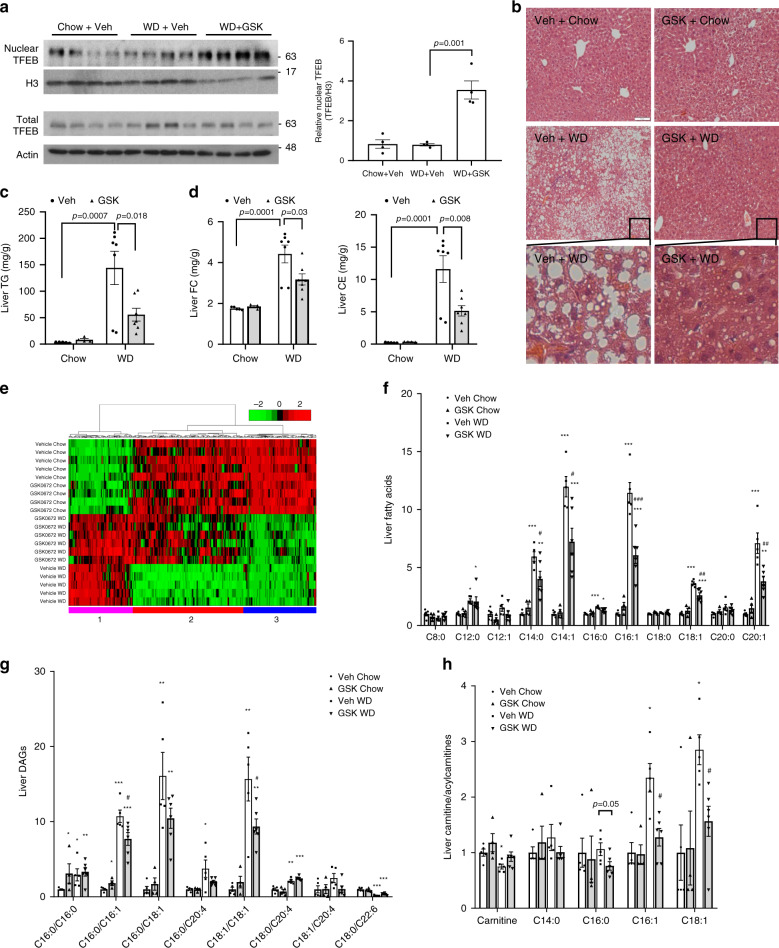
Fig. 7. ASBT inhibitor improved hepatic steatosis in WD-fed mice.
Male 10-week-old C57BL/6J mice were fed a chow or WD for 10 weeks, and treated with 2 mg kg−1 GSK or vehicle (Veh) daily via oral gavage for 2 weeks. a TFEB protein in total liver lysates and nuclear fractions. H3 histone 3. Veh vehicle. Nuclear TFEB intensity was normalized to H3 intensity. n = 4 mice per group. Two-sided Student’s t-test was used. b Representative hepatic H&E staining of at least four mice per group. Scale bar: 50 µm. c, d Hepatic triglyceride (TG), cholesterol ester (CE) and free cholesterol (FC) content. n = 5 mice per group for Veh + Chow; n = 4 mice per group for GSK + Chow; n = 7 mice per group for Veh+WD and GSK + WD. Two-way ANOVA and Tukey post hoc were used. e Heatmap of hierarchical clustering analysis. Total of 329 metabolites. Cluster 1 contains 85 metabolites. Cluster 2 contains 147 metabolites. Cluster 3 contains 97 metabolites. f Hepatic medium chain and long chain fatty acids. g Hepatic diacylglycerols (DAGs). h Hepatic carnitine and acylcarnitines. All results were expressed as mean ± SEM. For f–h, *p < 0.05; **p < 0.01; ***p < 0.001, vs. Veh + Chow. #p < 0.05; ##p < 0.01; ###p < 0.001, vs. Veh+WD. Two-way ANOVA and Tukey post hoc were used for f–h. Source data for a, c, d are provided as a Source Data file. Source data for metabolomics data (e–h) are available upon reasonable request.

