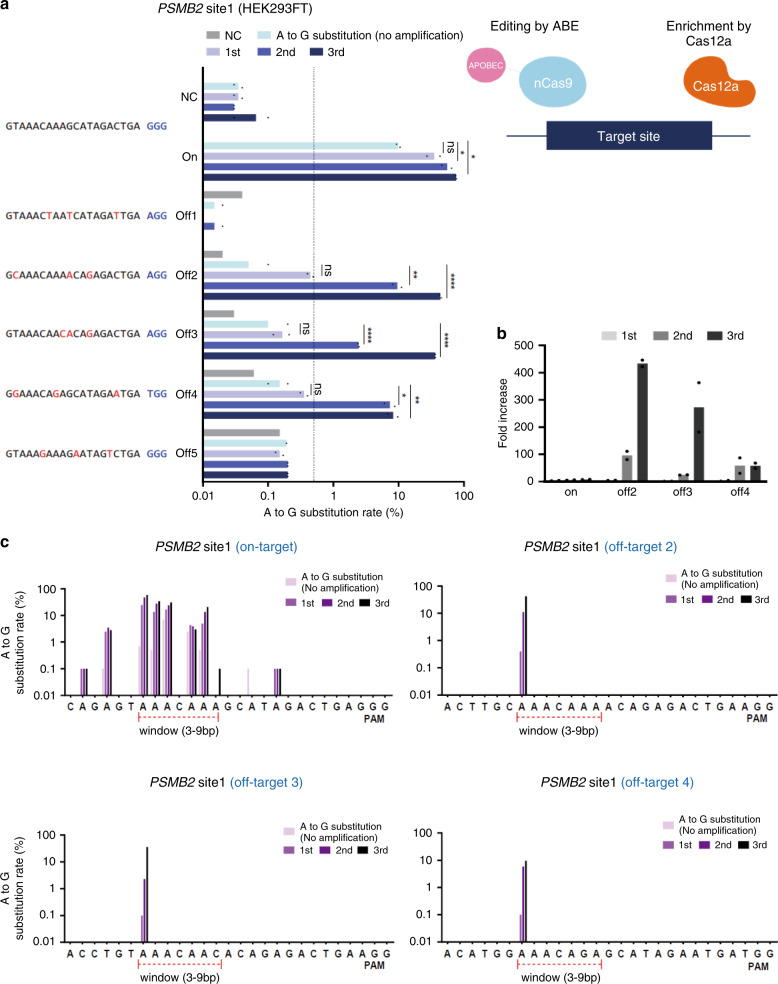
Fig. 4. Detection of single-base off-target mutations induced by ABE.
a Left: detection of off-target mutations for the target sequence (PSMB2 site1) generated by ABE in HEK293FT cells. NGS was used to confirm whether single-base mutations in target and non-target sequences can be amplified by CRISPR amplification. The Y axis represents the amplified target and off-target sequences, and the X axis represents the base substitution (A>G) frequency (%) in the analyzed amplicons on a log scale. NC indicates a negative control for no ABE delivery into the cells. The dashed line indicates the NGS detection limit (=0.5%). Data are shown as mean from two (N = 2) independent experiments. P-values are calculated using a one-way ANOVA, Tukey’s test (ns: not significant, *P = 0.0332, **P = 0.0021, ***P = 0.0002, ****P = 0.0001). Each amplification stage for mutant DNA enrichment is shown in light purple (NC), cyon (no amplification), light blue (1st CRISPR amplification), blue (2nd CRISPR amplification) and dark blue (3rd CRISPR amplification). Right: schematics of the target-specific editing with ABE and mutant DNA enrichment with Cas12a, respectively. b Fold increases in single-base substitution rates (%) after CRISPR amplification (N = 2) for target and off-target sequences. Primary, secondary, and tertiary CRISPR amplification fold increases are shown in gray, dark gray, and black. c Percentages of single-base substitution (A to G) frequency (%) in target and off-target sequences according to no, 1st, 2nd, and 3rd amplification, respectively. The target window (3–9 bp from PAM distal region) is indicated in each panel.

