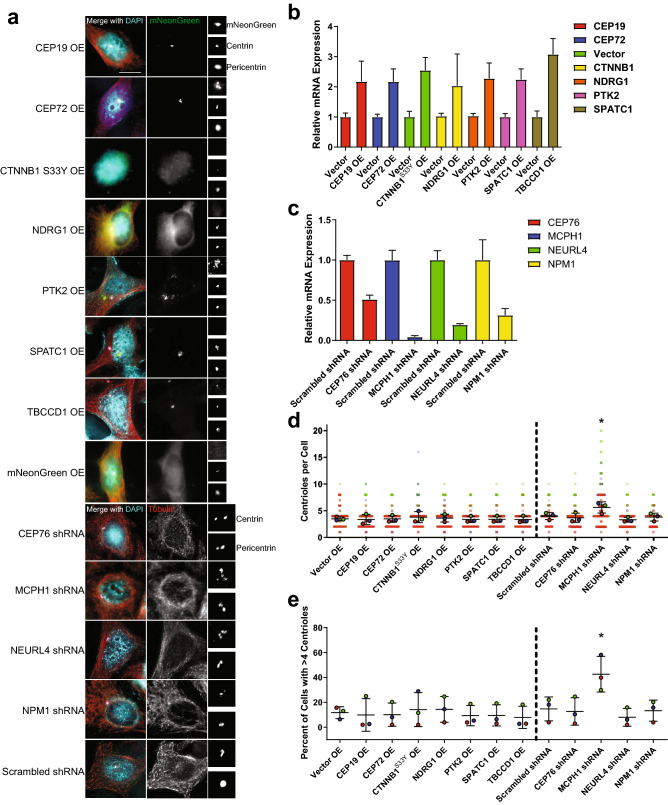
Figure 2.
In vitro screening of lead candidates of centrosome amplification. (a) Representatives images of HeLa cells overexpressing mNeonGreen-tagged cDNAs corresponding to genes for which gain of function is hypothesized to cause CA, as well as shRNA-mediated depletion of genes for which loss of function is hypothesized to cause CA. The centrosome region is enlarged and shown in the images on the right side of the panel. Blue = DAPI, red = α-tubulin, green = mNeonGreen, white = pericentrin, pink = centrin. Scale bar = 5 µm. (b) qRT-PCR was performed to assess the amount of overexpression of the mNeonGreen-tagged genes. (c) qRT-PCR was performed to assess gene depletion by shRNA. For both (b) and (c), bars represent means normalized to control (vector or scrambled shRNA) ± SEM for three independent experiments. (d) Quantification of centrioles (centrin foci) in the indicated conditions. For cells in which a transgene was overexpressed, only cells with visible mNeonGreen expression were counted. Each larger outlined circle represents the average of technical replicates for one independent experiment, and each individual cell is shown as a more transparent dot of the same color. (e) Quantification of the percentage of cells with CA, defined as greater than 4 centrioles (centrin foci). Each dot represents an independent experiment. For (d) and (e), bars represent means ± SEM for three independent experiments, which include approximately 250 total cells per condition. The vertical dotted lines separate overexpression from depletion/shRNA experiments. *P value < 0.05. HeLa cells were used throughout this figure.

