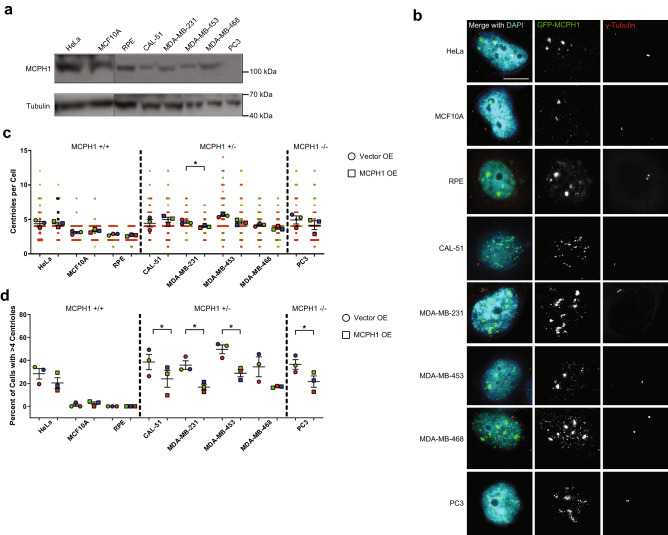
Figure 7.
MCPH1 overexpression reduces centrosome amplification in MCPH1-deficient cancer cell lines. (a) Western blots demonstrating MCPH1 levels in cell lines without MCPH1 deletion (HeLa, MCF10A, and RPE), heterozygous MCPH1 deletion (CAL-51, MDA-MB-231, MDA-MB-453, and MDA-MB-468), and homozygous MCPH1 deletion (PC3). Indications are made for molecular weight markers. (b) Immunofluorescence images of the cell lines from panel (a) transfected with GFP-MCPH1 or GFP control. (c) Quantification of centrioles in the conditions shown in panel (b). Each dot represents a single cell, color coded by each independent experiment, with mean values for each experiment indicated by larger, outlined dots. Bars represent mean ± SEM from 3 independent experiments. (d) Quantification of CA, defined as the percentage of cells with greater than 4 centrin foci. Each dot represents a single experiment, and bars represent means ± SEM. Vertical dotted lines are shown to separate cell lines based on MCPH1 status.

