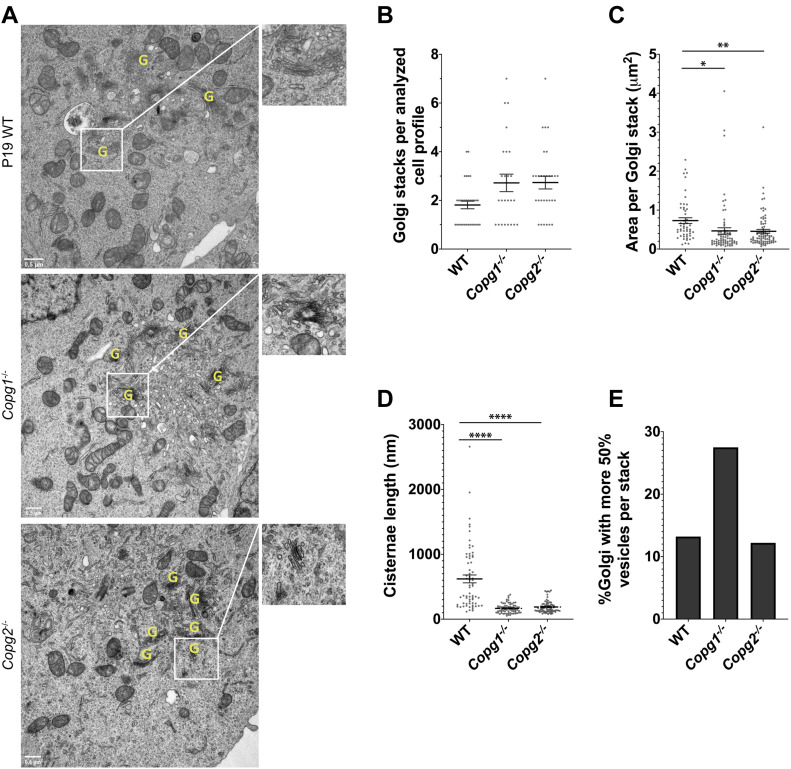
Figure 3. Depletion of γ1-COP or γ2-COP affects Golgi morphology.
(A) Electron micrographs of thin sections obtained from P19 WT, Copg1−/−, and Copg2−/− cells as indicated. Identified Golgi stacks are indicated by a yellow G. (B, C, D, E) Quantification of (B) average number of Golgi stacks per cell, (C) average area per Golgi stack, (D) average cisternae length, and (E) percentage of Golgi stacks with more than 50% of vesicles per stack (P-value: * < 0.05, ** < 0.01, **** < 0.0001, n = 30, except for (D): n = 66–72). In (B, C, D) bars are means and error bars are SEM.

