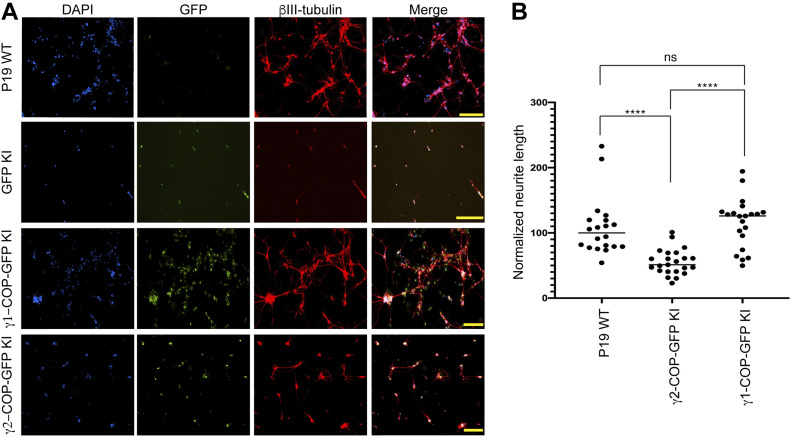
Figure 8. Overexpression of γ2-COP does not compensate the absence of γ1-COP during neurite outgrowth.
(A) Representative fluorescence microscopy images of P19 WT, GFP KI, γ1-COP-GFP KI, and γ2-COP-GFP KI cells as indicated at day 8 of differentiation to analyze the expression of the neuronal marker βIII-tubulin (indirect immunofluorescence) and GFP (direct fluorescence). Scale bar is 200 μm. (B) Quantification of the normalized neurite length (number of pixel/cell). (A) Each dot represents the value obtained for one picture (usually corresponding to ca. 100 cells) as in (A). 20 random images (a total of ca. 2,000 cells) were taken for the analysis. The horizontal bars represent the median value (set to 100 for WT) obtained for each cell line. **** indicates P-value < 0.0001, ns, nonsignificant, n = 20.

