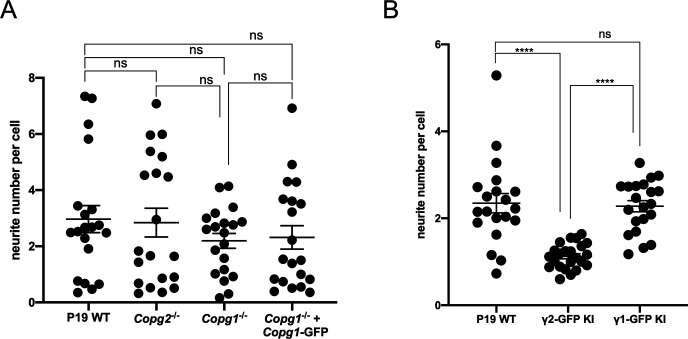
Figure S6. Quantification of neurite number per cell.
(A) Quantification of the number of neurite per cell (number of neurite attachment point/Tuj-1 positive nucleus). Each dot represents the value obtained for one picture (usually corresponding to ca. 100 cells) as in Fig 6A. 20 random images (a total of ca. 2,000 cells) were taken for the analysis. The horizontal bars represent the median value obtained for each cell line. (A, B) Same as (A) for the cell lines analyzed in Fig 8B. A two-tailed unpaired t test was performed for the statistical significance analysis (**** indicates P-value < 0.0001, ns, nonsignificant, n = 20).

