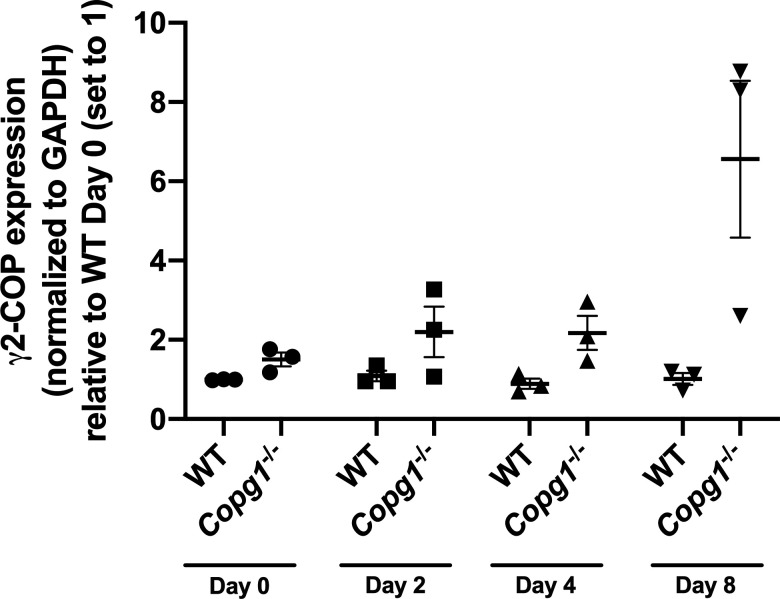
Figure S8. Quantification of γ2-COP expression in WT and Copg1−/− cells during differentiation.
Western blot signals for γ2-COP and GAPDH as on Fig 6C were quantified by densitometry. The ratios of γ2-COP over GAPDH signal measured from lysates obtained at the indicate days of differentiation are reported (n = 3).

