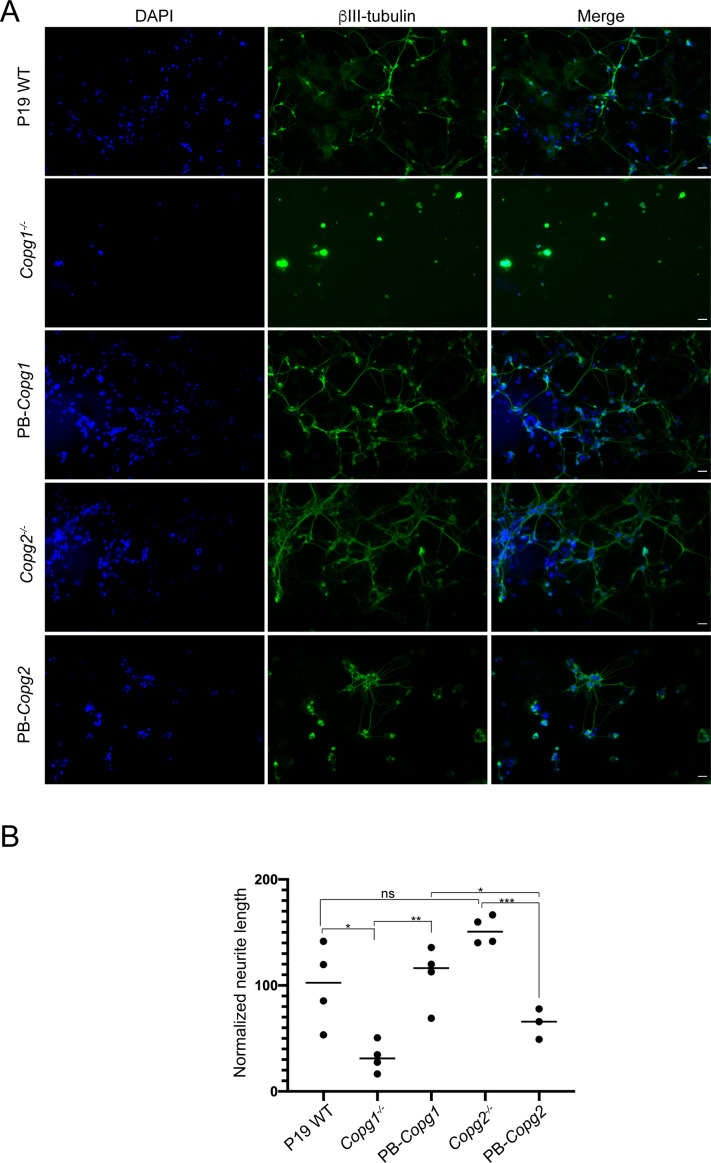
Figure S9. Overexpression of γ2-COP does not compensate the absence of γ1-COP during neurite outgrowth in PiggyBac rescued cells.
(A) Representative fluorescence microscopy images of P19 WT, Copg1−/−, PB-Copg1, Copg2−/−, and PB-Copg2 cells as indicated at day 8 of differentiation to analyze the expression of the neuronal marker βIII-tubulin (indirect immunofluorescence). (B) Quantification of the normalized neurite length (number of pixel/cell). (A) Each dot represents the value obtained for one picture (usually corresponding to ca. 100 cells) as in (A). Three to four random images (a total of ca. 400 cells) were taken for the analysis. The horizontal bars represent the median value (set to 100 for WT) obtained for each cell line. A two-tailed unpaired t test was performed for the statistical significance analysis (n = 3 or 4, P-value: * < 0.05, ** < 0.01, *** < 0.001, ns, nonsignificant). Scale bar is 30 μm.

