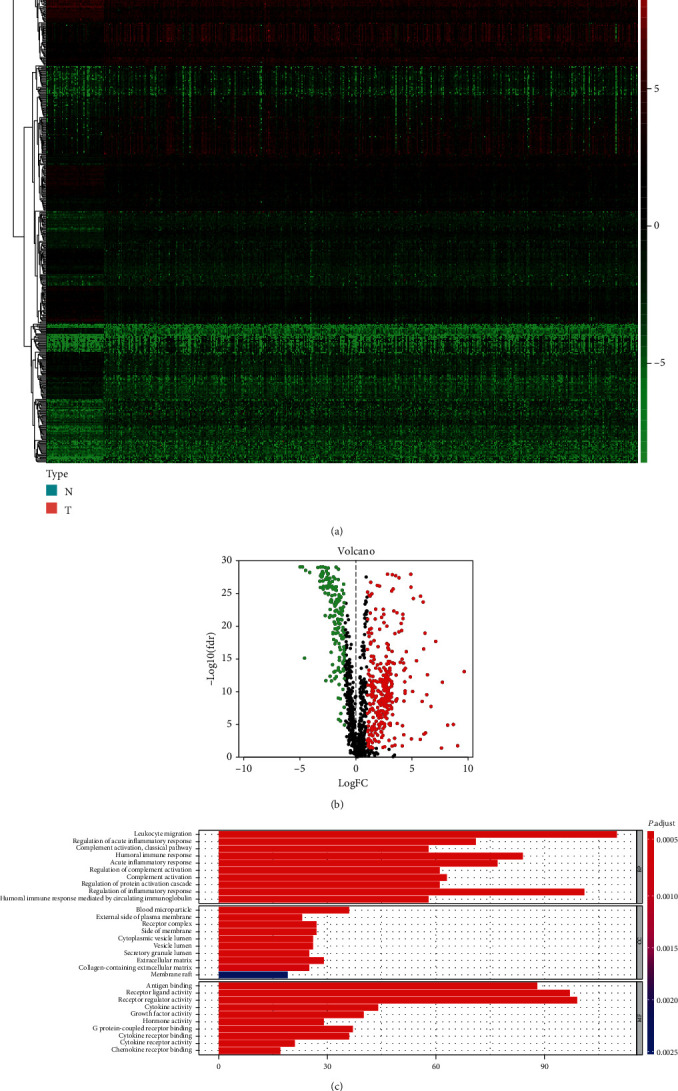
Figure 1.

(a) Heatmap of 488 differentially expressed IRGs. The red color indicated the higher gene expression values while the green color indicated the lower gene expression values. N indicated nontumor tissues. T indicated tumor tissues. (b) Volcano plot of 488 differentially expressed IRGs. (c) Bar plot of functional enrichment analyses. BP: biological process; CC: cellular component; MF: molecular function.
