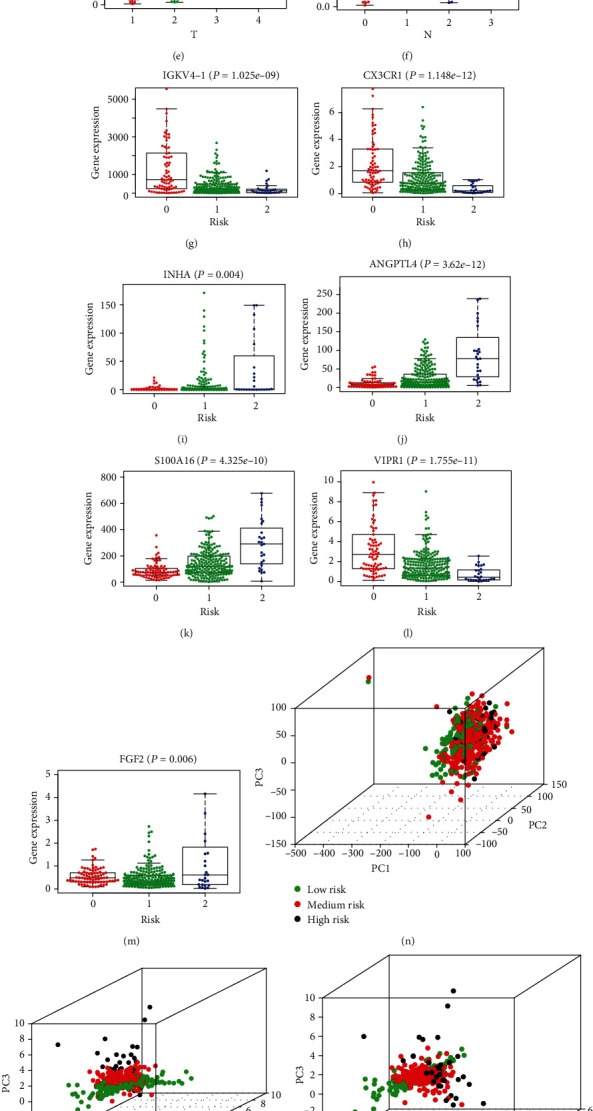
Figure 3.

(a, b) The correlation analyses between immune cells and the risk score showed that the contents of B cells and CD4 T cells in tumor tissues decreased with the rise of risk value. (c) The risk score was associated with survival outcome. “fustat = 0” represents “alive,” “fustat = 1” represents “dead.” (d–f) The risk score was significantly associated with pathological stages, T stages, and N stages. (g–m) IGKV4-1, CX3CR1, INHA, ANGPTL4, S100A16, VIPR1, and FGF2 showed different expression levels in the high-risk, medium-risk, and low-risk groups. “risk = 0” represents low risk. “risk = 1” represents medium risk. “risk = 2” represents high risk. (n) PCA depending on all genes from TCGA cohort. (o–q) PCA depending on the IRG model.
