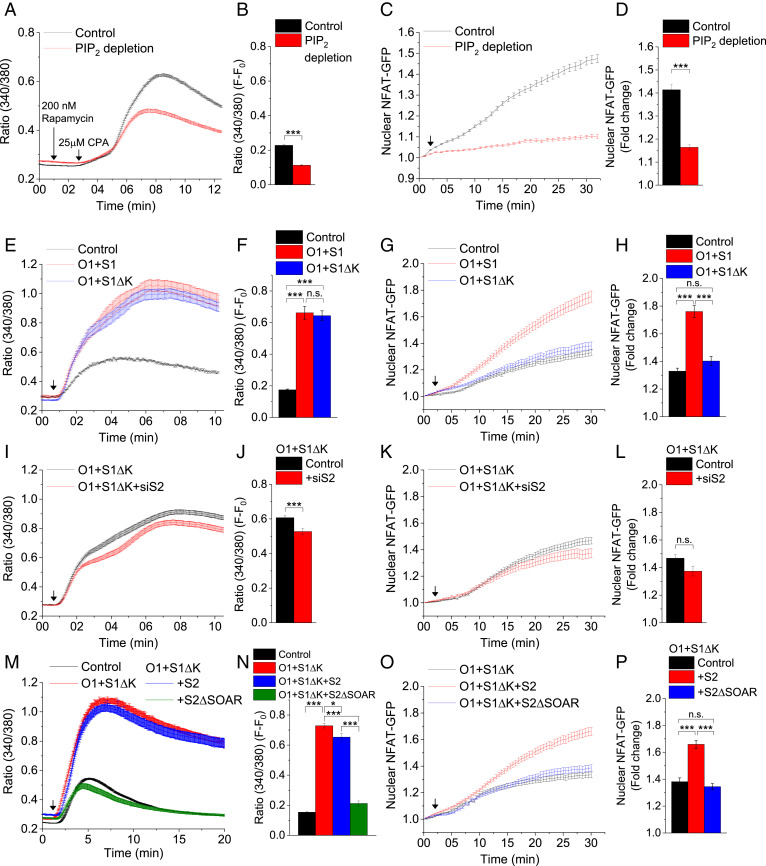
Fig. 2.
Orai1+STIM1ΔK expression triggers SOCE but does not increase NFAT1 activation. (A) Time-dependent increase in the Fura2 fluorescence ratio (340/380) in control and PIP2-depleted cells (with PIP2 depletion triggered by adding rapamycin [first arrow] to cells expressing rapamycin-inducible 5′-phosphatase) following stimulation with CPA (second arrow). (B) Increase in the 340/380 ratio at the 10-min time point (F-F0) in the control and PIP2-depleted cells shown in A. (C) Relative increase in nuclear NFAT1-GFP in control and PIP2-depleted cells. (D) Relative increase in nuclear NFAT1-GFP in control and PIP2-depleted cells at the 30-min time point, calculated from data in C. (E) Fura2 fluorescence increase induced by CPA in control cells and cells expressing Orai1+STIM1 (O1+S1) or Orai1+STIM1ΔK (O1+S1ΔK). (F) Increase in the 340/380 ratio at the 10-min time point (F-F0) in all three sets of cells shown in E. (G) Relative increase in nuclear NFAT1-GFP following CPA stimulation of control cells and cells expressing either O1+S1 or O1+S1ΔK. (H) Relative increase in nuclear NFAT1-GFP at the 30-min time point calculated from the data in G. (I) CPA-induced [Ca2+]i increase in cells expressing O1+S1ΔK or O1+S1ΔK+siS2. (J) Increase in the 340/380 ratio at the 10-min time point (F-F0) in O1+S1ΔK and O1+S1ΔK+siS2 cells. (K) Time-dependent increase in NFAT-GFP in the nucleus of cells expressing O1+S1ΔK or O1+S1ΔK+siS2. (L) Relative increase in nuclear NFAT1-GFP fluorescence at the 30-min time point. (M) Increase in the Fura2 fluorescence ratio in control cells and cells expressing O1+S1ΔK, O1+S1ΔK+S2, or O1+S1ΔK+S2ΔSOAR (S2ΔSOAR: STIM2 lacking the SOAR domain). (N) Increase in the 340/380 ratio at the 10-min time point (F-F0) in all four sets of cells. (O) Relative increase in nuclear NFAT1-GFP fluorescence following CPA treatment of cells expressing O1+S1ΔK, O1+S1ΔK+S2, or O1+ S1ΔK+S2ΔSOAR. (P) Increase in nuclear NFAT1 at the 30-min time point. In all experiments, the addition of 25 μM CPA is indicated by an arrow on the graph. All values in the bar graphs are presented as mean ± SEM. Statistical tests were done using either Student’s t test for two groups or ANOVA with Sidak’s multiple comparisons test for two or more groups. *P < 0.05; ***P < 0.001; n.s., not significant (P > 0.05). For both SOCE and NFAT experiments, the graphs show averaged data from 100 to 300 cells per group.

