
Figure 1.
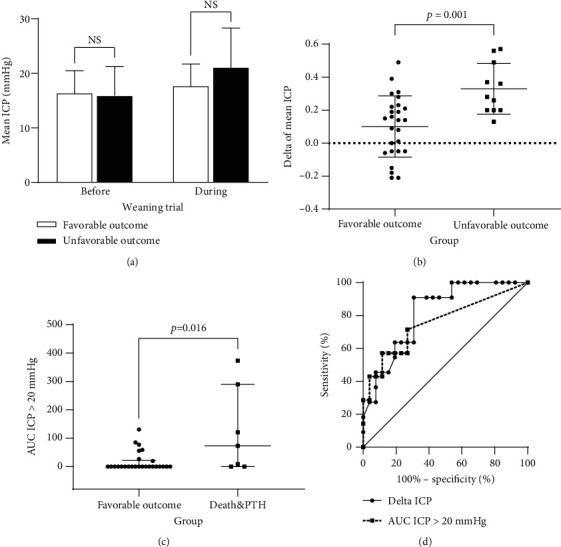
Comparison of the ICP: (a) there is no significant difference in the mean ICP before or during the weaning trial (p = 0.780 and p = 0.078, t-test); (b) the delta ICP is greater in the unfavorable outcome group (p = 0.001, t-test); (c) AUC for ICP > 20 mmHg is significantly different between the favorable outcome group and patients who died and developed PTH (p = 0.016, Mann-Whitney U test); (d) ROC analyses showing that the delta ICP has an AUC = 0.818 and p = 0.002, while the AUC for ICP > 20 mmHg has an AUC = 0.758 and p = 0.038.