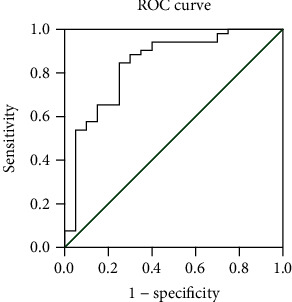
Figure 2.

ROC curve of the ratio of CD56bright NK to CD56dim NK. The curve plots the relationship between sensitivity and 1 − specificity for different cut-off levels. When 0.0487 was used as the cut-off point for the diagnostic score of suspected pSS patients, the maximum value of the Youden index was achieved as 0.596.
