
Figure 2.
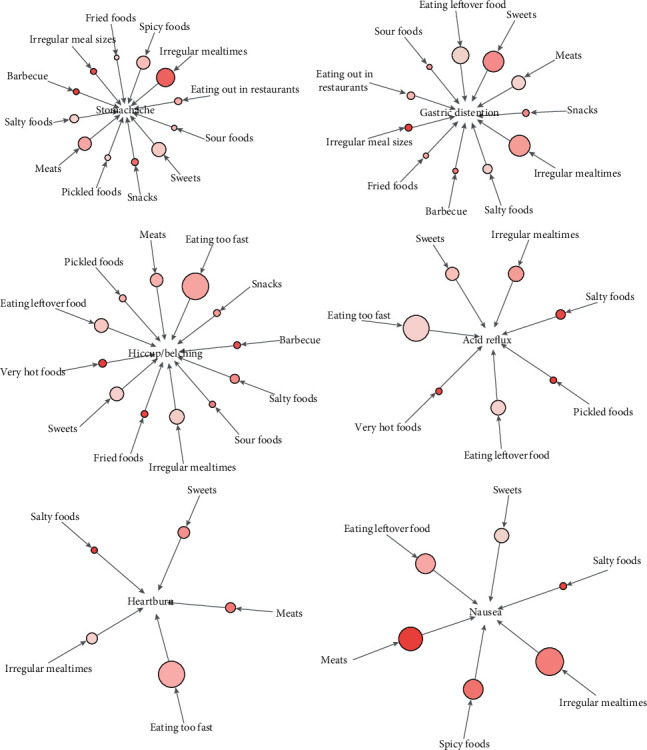
ARM analysis of symptoms and dietary factors. The arrows indicate the relationship between rules, and directions of the arrows indicate antecedent and consequent items. The size of the circle represents the level of “support” associated with the rule (the larger the circle, the larger the support value), and the color represents the level of “lift” with the rule (the darker the color, the larger the lift value).