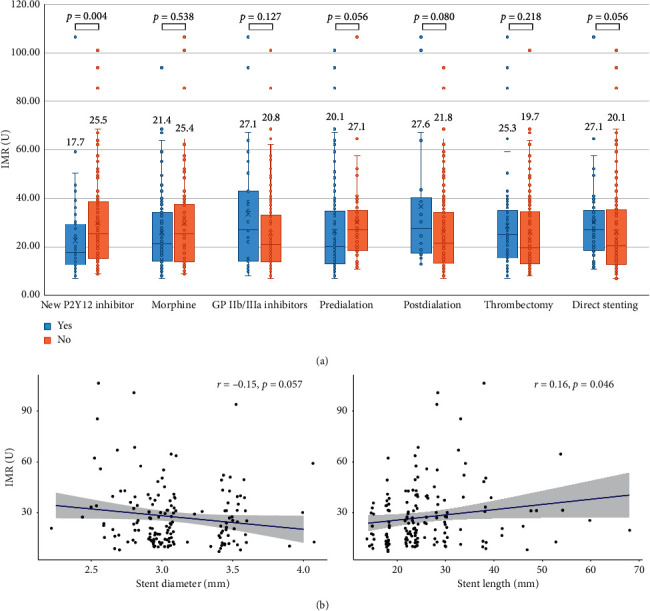
Figure 3.

Comparison of the index of microcirculatory resistance according to therapeutic strategies. (a) Each therapeutic strategy was displayed as box plots. The displayed number means the median value. (b) The association between IMR value and stent diameter/length was displayed as scatter plot.
