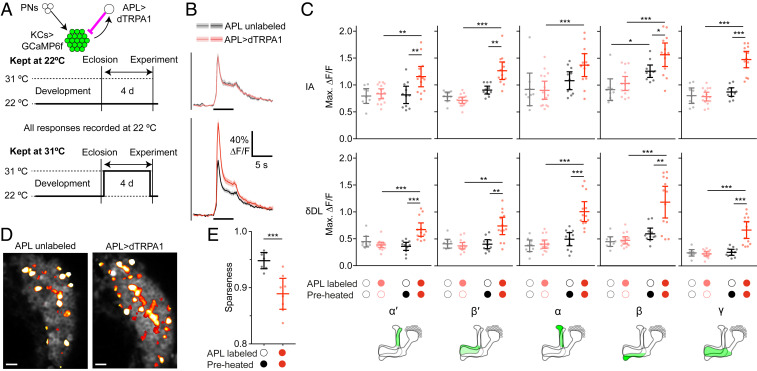
Fig. 2.
Kenyon cell odor responses are higher following prolonged excess inhibition from APL. (A) Diagram of genotype (green shows GCaMP6f expression; magenta shows activation with dTRPA1) and experimental protocol. Flies were raised at 22 °C, collected 0 to 1 d after eclosion, kept at 22 °C (control) or 31 °C (preheated) for 4 d, and returned to 22 °C for the imaging experiment. (B) Responses of the γ lobe to isoamyl acetate, for flies kept at 22 °C (Upper) or 31 °C (Lower), where APL was unlabeled (gray/black) or expressed dTRPA1 (pink/red). Black bars indicate 5-s odor pulse; shading indicates SEM. Responses of all lobes are shown in SI Appendix, Fig. S4. (C) Maximum ∆F/F of odor responses in all lobes to isoamyl acetate and δ-decalactone. *P < 0.05, **P < 0.01, ***P < 0.001, ANOVA (see SI Appendix, Table S2 for details). n, given as the number of hemispheres (number of flies), left to right within each graph: 9 (8), 15 (11), 11 (7), 13 (8). (D) Activity maps of responses to isoamyl acetate in KC somata. Grayscale shows baseline fluorescence of GCaMP6f; false-color overlay shows odor-responsive pixels. (Scale bars, 10 µm.) (E) Average sparseness to a panel of six odors (δ-decalactone, isoamyl acetate, ethyl butyrate, methylcyclohexanol, 3-octanol, and benzaldehyde; sparseness to each odor is shown separately in SI Appendix, Fig. S5). Mean ± 95% CIs. ***P < 0.001, unpaired t test.

