Fig. 5.
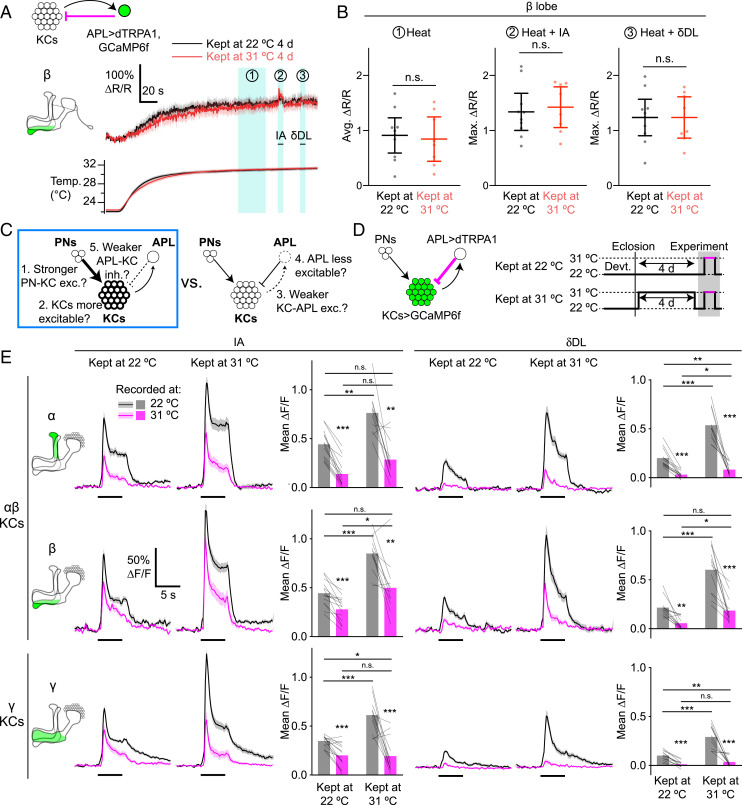
Different KCs show different effects of APL activation after adaptation. (A) APL is equally activated by dTRPA1 regardless of preheating. (A, Upper) Traces show GCaMP6f signal of the β lobe of APL (as determined by the anatomical marker MB247-dsRed), normalized to dsRed signal (hence ∆R/R, not ∆F/F), during perfusion heating of saline, in APL>TRPA,GCaMP6f flies kept at 22 °C (black) or 31 °C (red) for 4 d. Blue shading shows periods used for quantification in B. After the temperature reached a plateau (period 1), isoamyl acetate (period 2) and δ-decalactone (period 3) were presented. (A, Lower) Traces show the saline temperature corresponding to recordings in the Upper traces (same color scheme and timescale). Shading indicates SEM. Other lobes are shown in SI Appendix, Fig. S14. (B) Quantification of periods from A: average ∆R/R during temperature plateau (period 1) and maximum ∆R/R during odors (periods 2 and 3). Maximum ∆R/R is used for odors for consistency with Fig. 4. Graphs show mean ± 95% CIs. n.s., P > 0.05, unpaired t test or Mann–Whitney U test. n, given as the number of hemispheres (number of flies), left to right: 22 °C, 10 (8); 31 °C, 8 (6). (C) This figure tests mechanisms 1, 2, and 5 vs. mechanisms 3 and 4, and shows evidence for mechanisms 1, 2, and 5 (blue box) in αβ KCs. (D) Diagram of genotype (APL expresses dTRPA1; KCs express GCaMP6f) and experimental protocol for E. (E) Traces show responses of the α, β, and γ lobes to isoamyl acetate (Left) and δ-decalactone (Right) in KC>GCaMP6f and APL>dTRPA1 flies kept at 22 or 31 °C for 4 d, recorded at 22 °C (black) or 31 °C (magenta). Only paired recordings are shown (the same fly is recorded at both temperatures). Black bars indicate 5-s odor pulse; shading indicates SEM. Bar graphs quantify traces using mean ∆F/F during the odor pulse (the same color scheme as the traces; bars show the mean; thin lines show paired data recorded at 22 and 31 °C). Data for α′β′ KCs and maximum ∆F/F are given in SI Appendix, Fig. S15. *P < 0.05, **P < 0.01, ***P < 0.001, paired t test or Wilcoxon test (22 vs. 31 °C), unpaired t test or Mann–Whitney U test (across flies), with Holm–Bonferroni correction (see SI Appendix, Table S2 for details). n are as in SI Appendix, Figs. S6 and S7.

