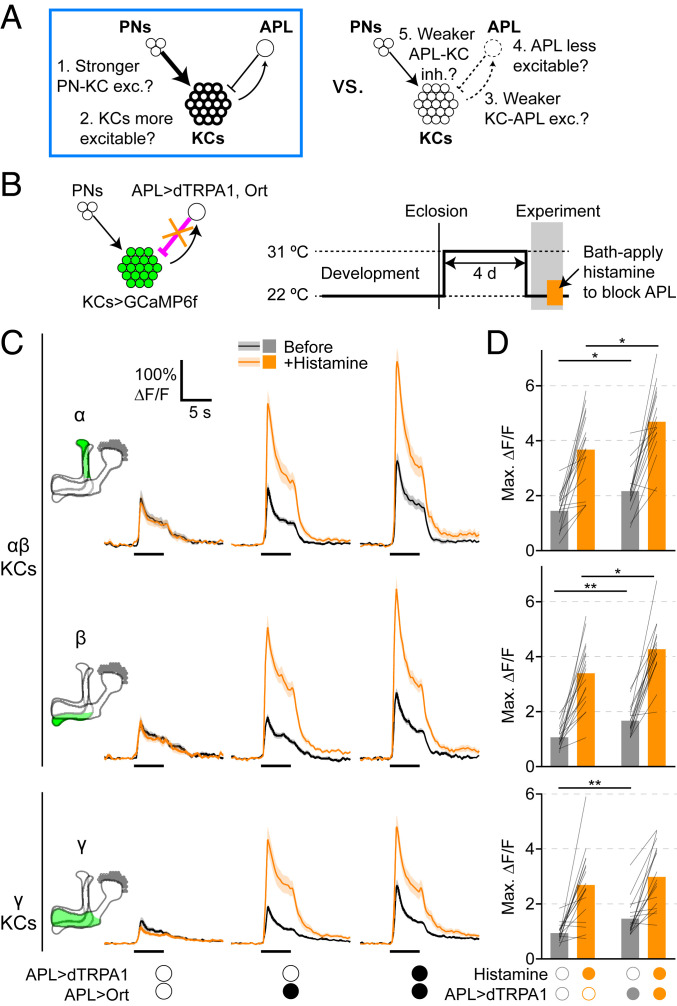
Fig. 6.
Adaptation effect remains in αβ KCs after removing inhibition from APL. (A) This figure tests mechanisms 1 and 2 vs. mechanisms 3 to 5, and shows evidence for mechanisms 1 and 2 (blue box) in αβ KCs. (B) Diagram of genotype and experimental protocol. Flies were raised at 22 °C, collected 0 to 1 d after eclosion, kept at 31 °C for 4 d, and returned to 22 °C for the imaging experiment. During the experiment, odor responses were recorded before and after bath applying 2 mM histamine. (C) Responses of α, β, and γ lobes to isoamyl acetate before (black) and after (orange) bath applying 2 mM histamine. Genotypes: mixture of hemispheres from APL>Ort and APL>dTRPA1,Ort flies where APL was unlabeled (Left), APL>Ort, APL labeled (Center), and APL>dTRPA1,Ort, APL labeled (Right). Shading indicates SEM. Traces of other lobes and responses to δ-decalactone are shown in SI Appendix, Figs. S16 and S17. (D) Maximum ∆F/F for traces in C. Genotypes: APL>Ort (Left), APL>dTRPA1,Ort (Right). Bars show mean; thin lines show paired data (same hemisphere before and after histamine). The effect of histamine was statistically significant in all cases (P < 0.001, paired t test or Wilcoxon test). *P < 0.05, **P < 0.01, unpaired t test or Mann–Whitney U test, Holm–Bonferroni correction for multiple comparisons (see SI Appendix, Table S2 for details). n, given as the number of hemispheres (number of flies), left to right: no dTRPA1, 17 (11); APL>dTRPA1, 16 (11).

