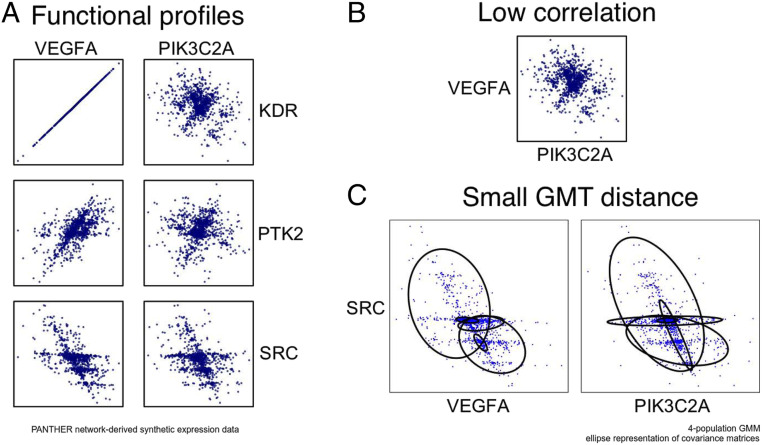
Fig. 2.
(A–C) An illustration of GMT comparison between two features. In this case the two features are not close because of correlation or a direct relationship between their values, but instead because of small GMT distance incorporating the relationships with other features. This comparison metric is an average of a Gaussian mixture model and optimal mass transport-based metric between the joint distributions (scatter plots) that are relevant according to the network topology. The gene network is the PANTHER curated database (http://www.pantherdb.org/), with numerical data synthesized from the network topology using the graph Laplacian described in Methods.

